Database Reference
In-Depth Information
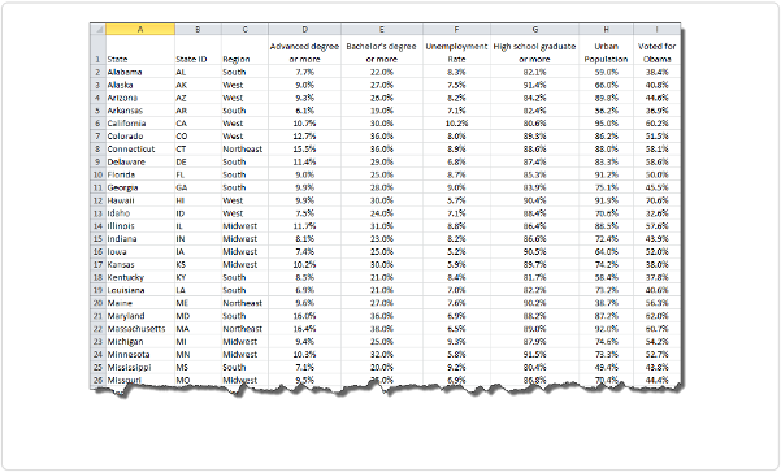
Figure 11-17. Spreadsheet of voting rates and demographics
By now you're familiar with how to connect Tableau to this data source and you're probably
already thinking of a number of ways to visualize these variables from the earlier chapters.
It's helpful to remember that as soon as we connect Tableau to the data, we have at our dis-
posal three other geographic elements for each U.S. state: its latitude, longitude, and shape.
In this section, we'll see how to make use of the built-in shape library to enhance our com-
mon chart types so as to aid cognition and memory.
Before we begin visualizing the data, let's do some extra setup to create a Parameter that we
can use to quickly toggle between views with different variables. Right-click in the Dimen-
sions area and click
Create Parameter
, then fill out the resulting dialog box with the inform-
ation shown in
Figure 11-18
.