Database Reference
In-Depth Information
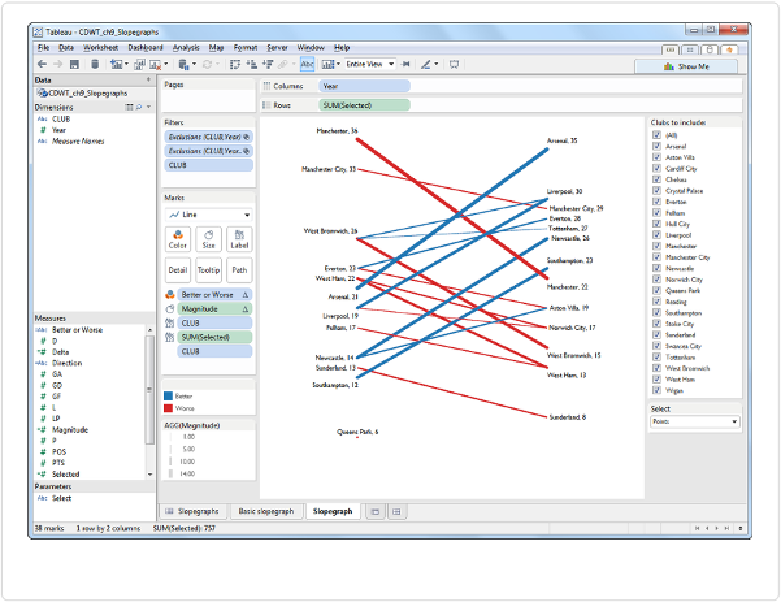
Figure 9-33. An updated slopegraph
I've also formatted the tooltips to yield a nice result when mousing over any of the line ends,
and I've hidden Marks that were placed in awkward positions on the slopegraph that I
couldn't adjust.
Step 6: Design the Dashboard
We'll cover dashboards much more starting in
Chapter 12
, but let's see how a finished dash-
board could look using this slopegraph example. After creating the slopegraph, we can add it
to a new dashboard, add the parameter control and a drop-down filter for Clubs as floating
dashboard objects, and then add a title and data source/reference information at the bottom.
With this view, we can do a whole lot more than find out what's behind Manchester's per-
formance; we can also notice other big changes, such as Liverpool's suddenly prolific of-