Database Reference
In-Depth Information
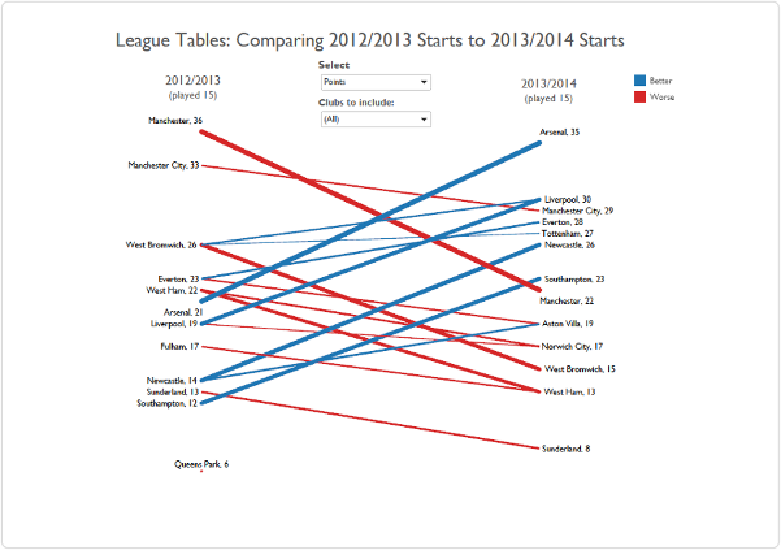
fense (select “Goals For”), or Southampton's dramatic improvement in defense (“Goals
Against” drops from 32 in 2012/2013 to only 14 in 2013/2014). See
Figure 9-34
.
Figure 9-34. A slopegraph comparing the points earned by clubs through 15 games
This is the value of the slopegraph. It allows us to make a whole host of point-to-point com-
parisons, and the largest magnitude changes literally jump to the surface.
Summary
In this chapter, we took a close look at a number of different ways to show quantities and
events over time. We considered simple line plots, dual-axis line plots, connected scatter-
plots, different levels of aggregation, forecasts, timelines, and finally slopegraphs.
In the next chapter, we'll move from time to the other ubiquitous element of our universe:
space.