Database Reference
In-Depth Information
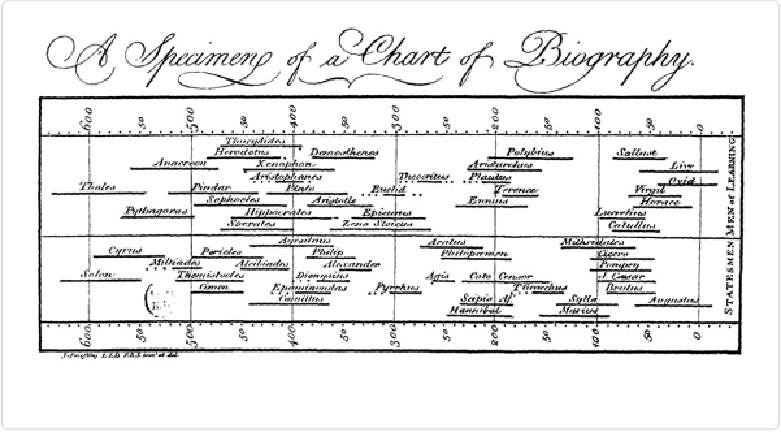
Figure 9-19. Joseph Priestley's first timeline:
Chart of Biography, 1765
This may seem like a rather obvious way to depict this type of information to us now, but it
was innovative to Priestley's readers. In our day, timelines such as these are used extensively
in project management, and Tableau includes a chart type known as a
Gantt Bar chart
to
make it easy to create one. Let's consider the history of presidents of the United States of
America as we examine how to create this type of timeline.
Wikipedia records the
day of birth
and
death
of each of the 44 U.S. presidents, as well as
their
first and last days in office
. These dates can be combined into a single spreadsheet, as
shown in
Figure 9-20
.