Database Reference
In-Depth Information
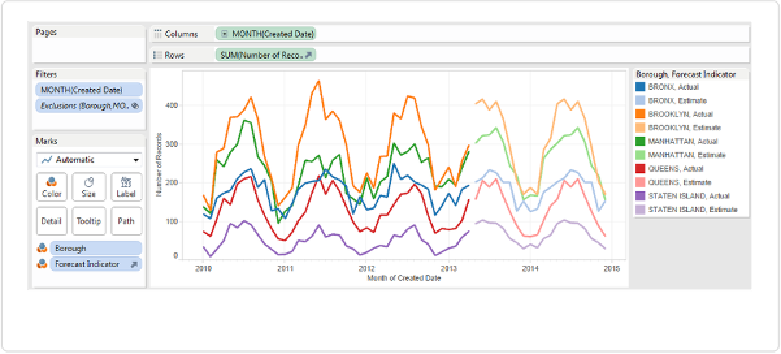
Figure 9-18. Rat sightings by month and borough, forecast added
There are a number of options associated with the forecast, such as the forecast length and
whether to include seasonality. These options can be accessed by right-clicking and selecting
Forecast
→
Forecast Options
. To see the full details associated with the forecast, choose
Describe Forecast
.
The line plot is the simplest and clearest way to show how quantities vary over time. But
what if we're interested in showing event durations in order over time, like the various pres-
idential administrations? That's where a timeline comes in handy.
The Timeline
Two decades prior to William Playfair's line plots, English theologian and chemist Joseph
Priestley created the first known timelines, in which each bar represents the life span of an
influential person of history (see
Figure 9-19
).