Database Reference
In-Depth Information
alized by adding a trend line to a scatterplot, and the indication of how well the points fit the
trend line is known as the coefficient of determination, R
2
(pronounced “R Squared”).
While making use of Tableau's regression functionality, let's consider a new combination of
rates: shots and goals. Shots can result in goals (and not the other way around), so we want to
place the
Shots
field on the x-axis (the Columns shelf), because this is typically where the
independent
variable is placed.
Goals
would then be placed on the y-axis (the Rows shelf),
the typical orientation of the
dependent
variable. We'll also need to add
Player
to the Detail
shelf so we don't just have one single dot, but rather one dot for each player. After taking
these steps, and also adding
Pos
to the Color shelf and
Player
to the Label shelf, we have
the standard scatterplot as shown in
Figure 8-15
.
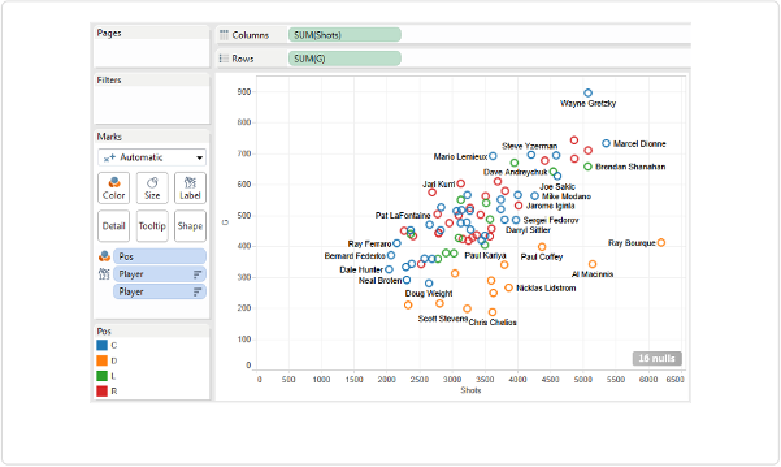
Figure 8-15. Scatterplot of shots versus goals
Notice the message at the bottom right that tells us there are 16 nulls. What does this mean?
It turns out that the league didn't start collecting the number of shots in their statistical mon-
itoring of games until after some of the players in the top 100 had already started playing, so
this information isn't available for all players. In the spreadsheet, there is a blank (as opposed
to a value of 0) for these 16 old-timers. We'll filter them out by clicking on the message and
selecting
Filter Data
.