Database Reference
In-Depth Information
pensation in 2012. The player who earned the most in 2012 has a salary that is more than 12
standard deviations away from the mean.
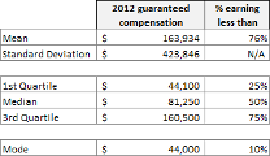
Let's consider the summary statistics for this data set as tabulated in
Figure 6-11
.
Figure 6-11. Summary statistics for 2012 player compensation
Which is the best measure of central tendency? Which measure would you consider “typical”
of player salaries? More than three out of four players earned less than the mean, and only
10% earned less than the mode, so neither seems very typical.
The median, by definition, has as many players above it as it has below it. This is why the
median is often used as the measure of central tendency when dollars are involved: because
the distribution is often quite skewed. Think about the median home price in your zip code,
or the median annual salary of employees in your workplace.
Sensitivity to Outliers
To illustrate the point further, let's consider the hypothetical impact to the measures of cent-
ral tendency of adding one of the world's top-paid soccer players to the league. The world's
top soccer players (e.g., Lionel Messi and Cristiano Ronaldo) command about
$20M in
salary (not including endorsements)
. How would the summary statistics change if a new
player like this were added to the mix? Consider the updated tabulation of statistics shown in