Database Reference
In-Depth Information
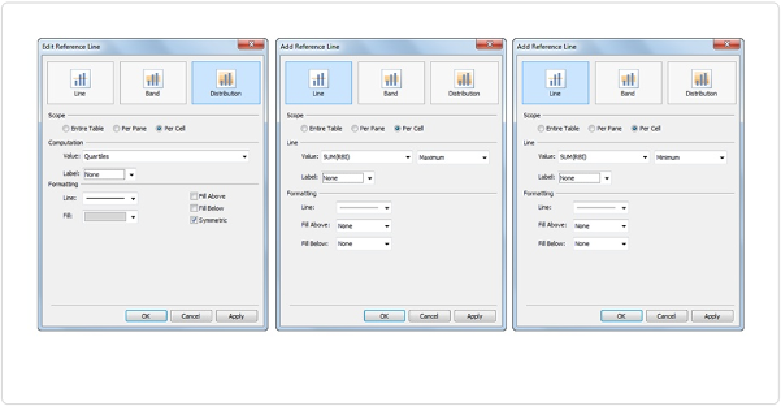
Figure 6-7. Add Reference Line dialog boxes
The dialog box on the left results in the shaded region known as the “interquartile range” for
each of the eight positions. The dialog box in the middle creates the eight horizontal lines at
the top of each box plot (maximum), and the dialog box on the right creates the lines at the
bottom (minimum). The resulting box plot is shown in
Figure 6-8
.
To add the dots for the mean, click
RBI
in the Measures panel with the right mouse button
and drag it onto the Rows shelf to the right of the existing
SUM(RBI)
. Select
AVG(RBI)
in the
menu that appears when you release the right mouse button.
A second chart now appears below the box plot, and also notice that the Marks area changes
to have three sections: the top section for
All
, or both; the middle section for
SUM(RBI)
; and
the bottom section for
AVG(RBI)
. Click in the
AVG(RBI)
section, change the Marks type to
Circle
, and drag the
Player
field out of the Marks card. The view on the bottom changes to a
dot plot of means.