Database Reference
In-Depth Information
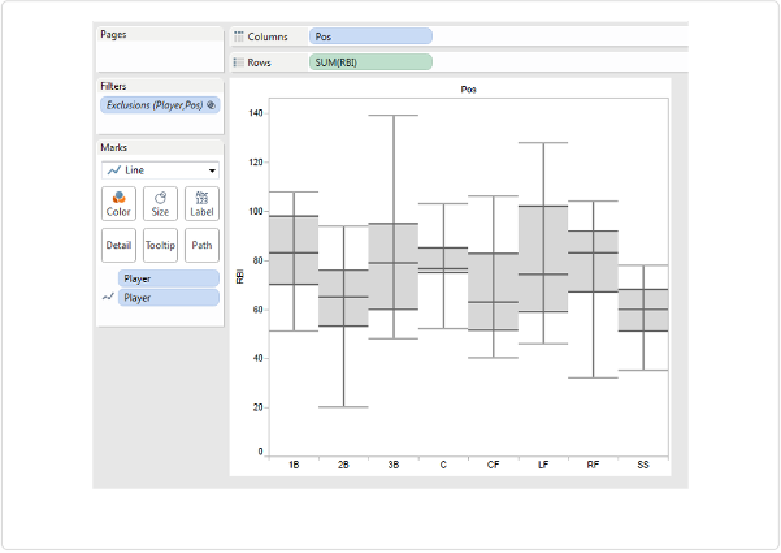
Figure 6-8. The box plot without the mean
Hover over the green
AVG(RBI)
pill in the Rows shelf, and when the small down arrow ap-
pears within the pill, click it and then select
Dual Axis
from the drop-down menu. The two
charts in the view now overlap, and a second y-axis appears to the right. The two y-axes
aren't yet synchronized (they have different maximum values). Right-click in the y-axis on
the righthand side, and select
Synchronize Axis
, as shown in
Figure 6-9
.