Geology Reference
In-Depth Information
a)
b)
c)
Lith
Phi
AI Syn
Well
0.75
-100
0.5
0.25
-50
0
0
-0.25
-0.5
-0.75
50
100
Synthetic shift (ms)
Amplitude
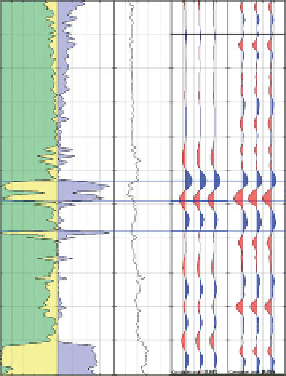
Figure 4.17
Example well tie generated using 1800 constant phase wavelet based on the amplitude spectrum derived from the data;
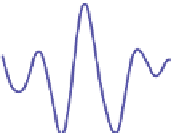
(a) synthetic trace ('Syn') compared to the well location trace ('Well') and, (b) 1800 wavelet, (c) cross-correlation over 500 ms window.
a)
b)
c)
Lith
Phi
AI Syn
Well
0.75
-100
0.5
0.25
-50
0
0
-0.25
-0.5
-0.75
50
100
Synthetic shift (ms)
Amplitude
Figure 4.18
Example well tie generated using 50° constant phase wavelet based on the amplitude spectrum derived from the data;
(a) synthetic trace ('Syn') compared to the well location trace ('Well') and, (b) 50° wavelet, (c) cross-correlation over 500 ms window.
very good tie (PEP
0.91)
where the seismic can be tied only with a zero phase
wavelet. Indeed,
¼
83%, cross-correlation
¼
4.6 Well tie issues
4.6.1 Seismic character and phase
ambiguity
In situations where the seismic data show a distinctive
character, there is often little ambiguity about the
phase of the data.
Figure 4.19
shows an example of a
t matter too
much which wavelet was used; so long as it had
an appropriate bandwidth and was zero phase a very
good tie would result in this case. In general, this
type of clarity depends on the presence of a number
of
it probably wouldn
'
50
strong reflections
from layers with varying