Geology Reference
In-Depth Information
a)
b)
V
sh
Phi
e
S
we
V
p
ρ
σ
0
1 0.5
0 1
0 1.95
2.95 2000 4000 0
0.5
V
sh
1
1
0.8
0.6
0.4
0.2
0
-0.2
-0.4
-0.6
-0.8
0.75
0.5
0.25
-1
0
0.1
0.2
0.3
Porosity
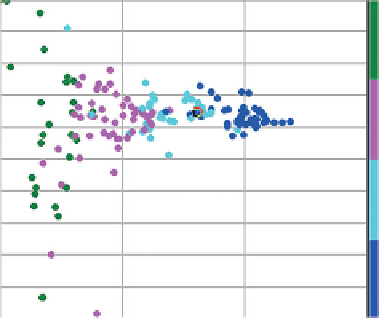
Figure 8.58
Fluid substitution in shaley sands - effective porosity approach. (a) Fluid substitution to gas is done using dry rock data derived
from the logs (blue curves ¼ brine, red curves ¼ gas; depth marker spacing is 10 m). Note that there are exaggerated substitution effects on
the compressional velocity and Poisson's ratio logs in shale-prone zones. This is the result of inconsistencies in the inputs to Gassmann's
equation (after Simm,
2007
). (b) Gassmann dry rock properties derived from the brine fill logs in (a). Data points are coloured by shale volume,
as indicated by the key on the right. Note that the clean sands give reasonable results but there are erroneous negative dry rock moduli in the
shaley zone (after Simm,
2007
).
a)
b)
Vcl
Vcl
1
1
1
0.8
0.6
0.4
0.2
0
-0.2
-0.4
-0.6
-0.8
1
0.8
0.6
0.4
0.2
0
-0.2
-0.4
-0.6
-0.8
0.75
0.75
0.5
0.5
0.25
0.25
-1
0
-1
0
0.1
0.2
0.3
0.1
0.2
0.3
Porosity
Porosity
Figure 8.59
Fluid substitution in shaley sands
-
total porosity approach. Dry rock data inverted using Gassmann
'
s equation with varying
193
clay mineral moduli; (a)
K
cl
¼
37.5 GPa,
μ
cl
¼
18.7 GPa; (b)
K
cl
¼
10 GPa,
μ
cl
¼
4.7 GPa. Data points are coloured by shale volume, as indicated by
the key on the right (after Simm,
2007
).