Geology Reference
In-Depth Information
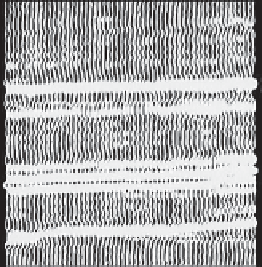
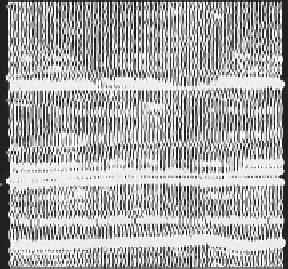
(b) lithology cubes together with
corresponding interpretation crossplots
(c) and (d). Log curve shown in (a) and (b)
is gamma ray (sections courtesy Apache
Corporation).
+
So
-
40ms
c)
Projection
axis
d)
G
G
-
+
R(0)
R(0)
-
+
Projection
axis
a)
b)
Figure 7.16
Woodbine Sands, East
Texas, Class I gas sand scenario (after
Peddy et al.,
1995
); (a) migrated full stack
section showing dimming of Woodbine
sand reflectors when gas filled, (b) section
showing bright water wet reflectors, (c)
gathers contrasting gas and water wet
AVO signatures.
c)
A
I
=
200ms timing lines
138
Offset
Offset


