Geology Reference
In-Depth Information
a)
c)
y=-2.31x
0.4
oil
wet
wet fit
0.3
0.2
0.1
0
-0.1
-0.2
Zoeppritz 10º
-0.3
-0.3
-0.2 -0.1
0
0.1
0.2
0.3
AI
Intercept
=
b)
d)
Zoeppritz 30º
Shuey projection 41º
Figure 7.17
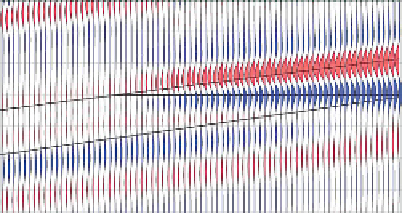
Class I oil sand model; (a) near angle section showing dimming related to oil presence, (b) far angle model showing little
reflectivity at the top reservoir and trough termination at the contact, (c) AVO crossplot, (d) projection section (Shuey's equation used
with
θ
¼ 41°).
W
E
Thylacine-1
Thylacine-2
Top Thylacine
Sandstone Member
1500
Top Flaxman
Top Waare
GWC
GWC2
Top Waare coals
2000
1000m
139
Figure 7.18
Migrated stack section from the Thylacine gas discovery in the Otway basin, offshore Australia (after Cliff et al.,
2004
).