Biomedical Engineering Reference
In-Depth Information
Table 2.4 S
e
and P+ figures for Ptb-db using squared derivative approach
Patient file ID and record no. in Physionet Lead I Lead III Lead aVR Lead V1 Lead V3
P236/s0462 (N) 96.29 100 85.71 100 100
P236/s0463 (N) 100 100 85.71 100 100
P246/s0478 (N) 100 71.05 100 100 100
P247/s0479 (N) 98.91 97.23 100 97.23 95.45
P248/s0481 (N) 100 100 96.55 100 100
P249/s0484 (M) 100 96.3 100 100 100
P265/s0501 (Ant-Lat) 100 100 100 100 100
P092/s0354 (MI-Inf) 100 98.52 99.24 97.56 98.12
P092/s0358 (MI-Inf) 96.11 98.42 99.12 100 100
P093/s375 (MI-Inf) 100 100 100 100 100
P262/s0498 (C) 100 100 100 100 100
Narration N Normal; M Myocarditis; MI Myocardial infarction; Ant Anterior; Inf Inferior;
C Cardiomyopathy
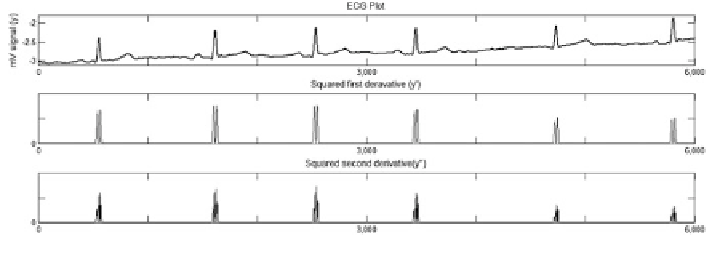
Fig. 2.7
R-peak detection using squared derivative approach
At first, the sample with highest second-derivative squared (say d2
0
array) is
located. Let this value is d2 max. Since the normal QRS region is around 96 ms, a
search in the original dataset (say, y2) around ± 45-ms window for highest value
would yield the R peak. This R peak is the sharpest R peak of the dataset. The
other QRS regions are found out by a search in the d2
0
dataset by locating samples
which exceed a preset threshold value (say, 5%) of the d2 max magnitude.
Starting from each of these index points, the corresponding R peak is determined
as the sample with highest magnitude within a ±45-ms window in the original data
array. Once all the R peaks are determined, their indexes are taken in an array and
average R-R interval is computed. The related algorithm steps are given in the end
of the chapter Appendix 2. Figure
2.8
a and b shows R-peak detection, baseline
modulation correction using ptb-db and mit-db data, respectively. Some test results
with ptb-db data are shown is table
2.4
.

Search WWH ::

Custom Search