Biomedical Engineering Reference
In-Depth Information
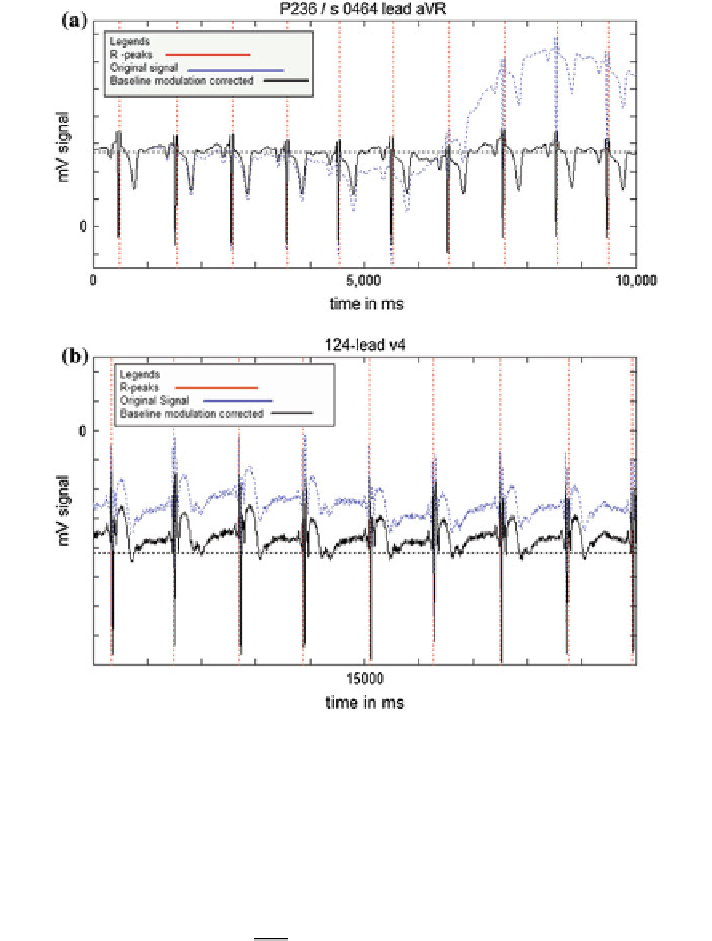
Fig. 2.6
R-peak detection from using differential ECG. a using ptb-db data, b using mit-db data
and then first and second derivative of the data are computed. In this approach,
numerical differentiation using Lagrange's five-point interpolation formula is used.
According to [
81
], five-point derivative prevents high-frequency noise amplifica-
tion. The formula used is given in Eq.
2.11
.
1
12h
f
0
¼
ð
f
2
8f
1
þ
8f
1
f
2
Þ
ð
2
:
11
Þ
where index '0' indicates current sample of reference and others are with
respect to the current position index, h refers to the tolerance level.
Figure
2.7
shows the original signal, with squared first- and second-derivative
plot. The squared signal after second derivative sharply localizes QRS regions.
The exact location of R peak is determined by a window search as follows:
Search WWH ::

Custom Search