Biomedical Engineering Reference
In-Depth Information
CM-1
(a)
4000
3200
2400 2000
1600
1200
800
400
1656
1556
1621
(b)
1626
1560
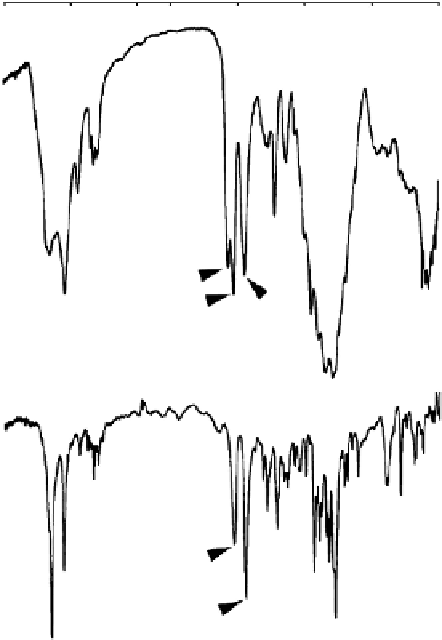
Figure 1.7
FTIR spectra of chitin for (a) single crystals of α-chitin and (b) deproteinized dried β-chitin from the tube of
Tevnia jerichonana
.
ferent signatures for α-chitin and β-chitin. For α-chitin, the amide I band is split at 1656
and 1621 cm
−1
, whereas it is unique, at 1626 cm
−1
, for β-chitin. In contrast, the amide II band
is unique in both chitin allomorphs: at 1556 cm
−1
for α-chitin and at 1560 cm
−1
for β-chitin.
The occurrence of two amide I bands for α-chitin has been the subject of debate. The band
at 1656 cm
−1
, which occurs at similar wavelengths in polyamides and proteins, is com-
monly assigned to stretching of the C=O group hydrogen bonded to N-H of the neighbor-
ing intrasheet chain. Regarding the 1621 cm
−1
band, which is not present in polyamides
and proteins, its occurrence may indicate a specific hydrogen bond of C=O with the
hydroxymethyl group of the next chitin residue of the same chain [60]. This hypothesis is
reinforced by the presence of only one band in this region for
N
-acetyl d-glucosamine [61].
Also, in α-chitin, the band at 1621 cm
−1
is modified in deuterated water, whereas the band
at 1656 cm
−1
remains nearly unaffected [62]. Other possibilities may also be considered, as
the band at 1621 cm
−1
could be either a combination band or an enol form of the amide
moiety [61].
Spectra of chitosan are shown in
Figure 1.8.
The spectra differences between chitosan
and chitin are amide band, −NH
2
band, and hydrogen. For chitosan, the amide I band is
Search WWH ::

Custom Search