Biomedical Engineering Reference
In-Depth Information
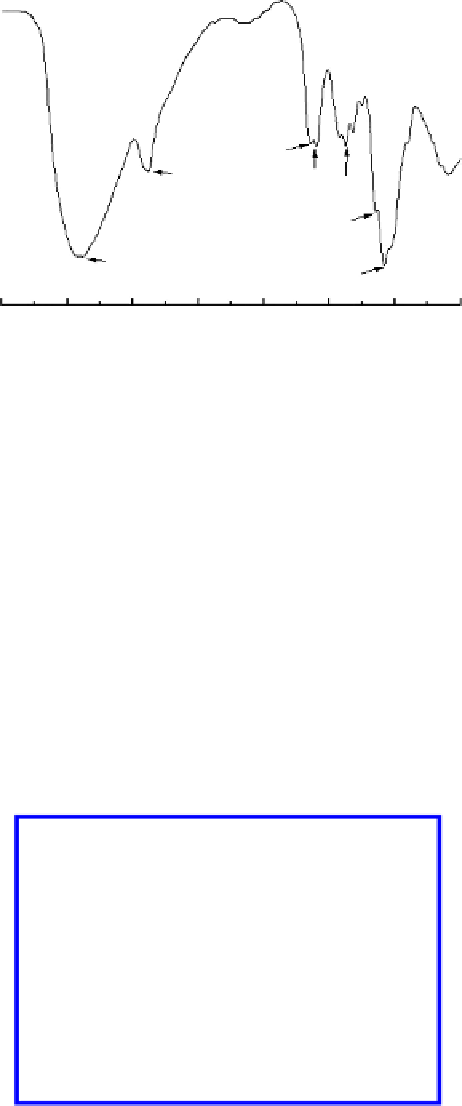
1650
2890
1595
1379
1152
3430
1080
4000
3500
3000
2500
2000
1500
1000
500
CM
-1
Figure 1.8
FTIR spectra of chitosan.
unique, at 1650 cm
−1
, indicating that the
N
-acetyl amino still exists in chitosan and its
absorption intensity is weaker than that of chitin. The band at 1595 cm
−1
is assigned to
-NH
2
and does not exist in chitin. The other bands of chitosan are similar to those of chi-
tin: 3430 cm
−1
for O-H stretching, 2890 cm
−1
for C-H stretching, 1379 cm
−1
for symmetric
distortion vibration bands of -CH
3
, 1152 cm
−1
for C-O-C stretching, and 1080 cm
−1
for C-O
stretching.
Figure 1.9 [63] gives the
1
HNMR spectrum obtained for chitosan dissolved in D
2
O con-
taining DCl (pD approximately 4). The signal at 1.95 ppm allows determination of the
acetyl content by reference to the H-1 signal at 4.79 ppm for the d-glucosamine residue and
at 4.50 ppm for the H-1 of the
N
-acetyl-d-glucosamine unit at 85°C.
2
3
4
1
5.0
4.0
3.0
2.0
ppm
Figure 1.9
1
HNMR spectrum of chitosan in D
2
O, pH 4,
T
= 85°C, conc. 5 g/L: (1) H-1 of glucosamine units, (2) H-1 of
N
-acetylglucosamine, (3) H-2, and (4) protons of the acetyl group of
N
-acetylglucosamine.

Search WWH ::

Custom Search