Geography Reference
In-Depth Information
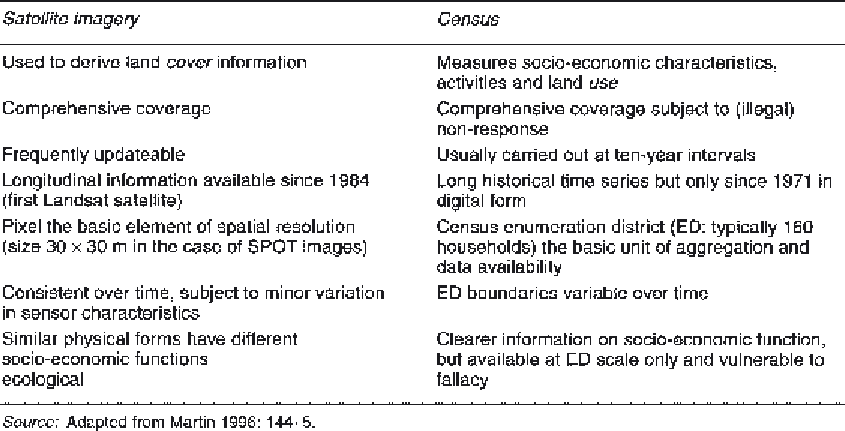
physical form of the city is satellite remote-sensing
information, and the most widely used socio-
economic source in the UK is the Census of
Population. Table 44.1 identifies some of the
important characteristics of each of these sources.
Remote sensing is an established means of
monitoring a wide range of environmental
phenomena, but the recent innovation of high-
resolution satellite images is making this source
increasingly appropriate to monitoring the
morphology of urban areas (Mesev
et al
. 1995).
Raw spectral signals are converted into a land
cover image using a classification technique that
results in a statistical model of the most likely
mosaic of land covers. GIS has developed to the
point where such classified images can be readily
analysed within most mainstream packages. The
morphology of a typical urban area (Norwich,
UK), as revealed by a Landsat image, is shown in
Figure 44.5D.
The UK Census of Population is
conventionally made available at enumeration
district scale and in choropleth map form (Figure
44.5B). Such representations present the
misleading impression that within-area densities
are uniform and hence that the only changes in
density occur across boundaries. The innovation
of GIS has made a much wider range of
transformations and projections possible, and one
such manipulation is to think of the distribution
of populations as a continually varying density
surface (Bracken and Martin 1989: Figure 44.5C).
Figure 44.5A shows one further choropleth
representation of the same settlement, but this
time broken up into the rather different geography
of postcode sectors.
It is important to remember that all of the city
maps shown in Figure 44.5 are
models
of reality.
The satellite image is derived from a statistical
classifier of reflected solar radiation, measured and
classified at the scale of the pixel (picture element),
and different classifiers would yield different
results; the choropleth map models the
distribution of a census variable as a mosaic of
uniform areas; and the surface model allocates the
data (in this case population) across a continuous
space by presuming that density decreases with
distance from each enumeration district centroid.
Applied urban geography has never had much to
do with remote sensing, because the resolution of
data generated from early satellites was too coarse
to discriminate between elements of the built
Table 44.1
Some characteristics of satellite imagery and UK census data.