Geography Reference
In-Depth Information
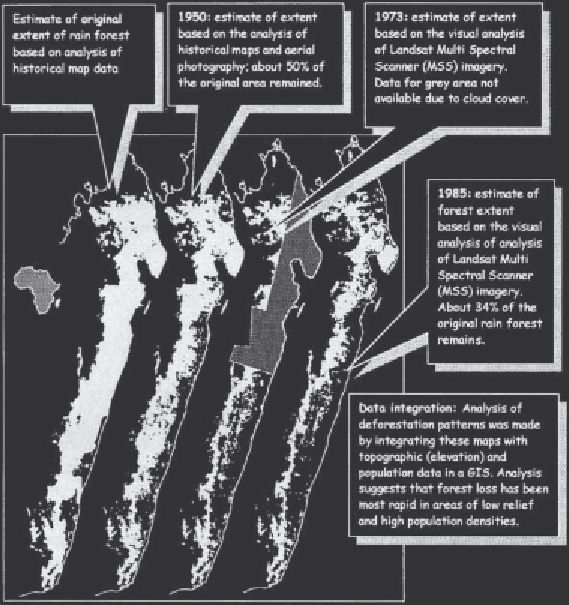
Figure 40.1
Mapping loss of
tropical rain forest in
Madagascar.
Source:
Green and Soussman
1990.
need to consider whether the change is measured
in terms of a simple
change of state
in the system or
whether it represents a more complex
transformation in the
behaviour or dynamics
of the
system over time.
analysis
in a little more detail. This diagram is the
framework around which the rest of this chapter
is built. We will show how remote-sensing systems
can help us to acquire information about the
Earth's surface and the way it is changing. We will
also see how these data can be linked with other
information in a GIS to understand what is
happening and to develop sound management
strategies. Hinton (1998) has recently highlighted
the importance of a closer integration of remote-
sensing and GIS technologies.
At the same time as describing how remote
sensing and GIS can be used to monitor and
understand environmental change, this chapter
will also look at some of the basic scientific
concepts that underlie the study of environmental
change. We will need to consider, for example, the
idea of setting up a
base line
against which we can
make judgements about the changes taking place
in an environmental system (Figure 40.3). We also
PUTTING THE WORLD INTO A
COMPUTER
If we think of a GIS as a computer-based system
that can be used to store, analyse and display spatial
or geographical data (Burrough and McDonnell
1998; Chrisman 1996), then clearly the first step
in setting up such a system is to acquire or capture
the information that we need. The process of data
capture involves the collection or conversion of
data in a digital, machine-readable format.
We cannot describe all the sources of digital
data that might be used in a GIS to study