Chemistry Reference
In-Depth Information
Mass Spectrum
1000
800
600
400
200
0
0.0000
100.0000
200.0000
300.0000
400.0000
500.0000
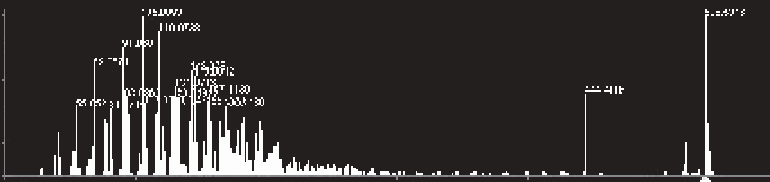
FIGURE 11.4
The mass spectrum of carotene, indicating the MH+ ion and subsequent
fragment peaks.
(2) Sudan (used as an internal standard); (3) all-
trans
β-cryptoxanthin; (4) all-
trans
β-crytoxanthin; (5) all-
trans
-β-zeaxanthin (see Section 11.3); (6-9) luteoxanthin iso-
mers; (10) all-
trans
-violaxanthin; (11) 9-
cis
-violaxanthin; (12) 13-
cis
- violaxanthin;
(13)
cis
-neoxanthin; and (14) all-
trans
-neoxanthin. The identification of each carot-
enoid can be confirmed by mass spectrometry (MS). As an example, the MS spec-
trum of β-carotene shown in Figure 11.4 reveals the molecular ion fragment, MH+,
and subsequent fragmentation to smaller ions, 14 mass units (CH2) apart.
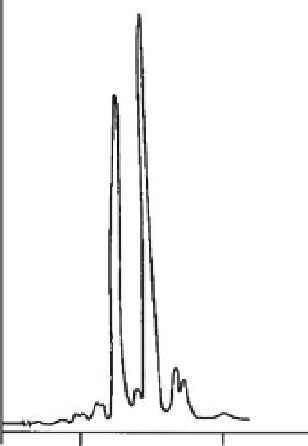
β-Carotene has been isolated from other sources, including carrots and algae. In
the HPLC chromatograms shown in Figures 11.5 and 11.6, the
cis
/
trans
isomers of
β-carotene have been isolated using a C-30 bonded reverse phase stationary phase.
In the former case, the separation was much faster and the peaks are sharper.
3
1
4
5
2
0
10
20
Time (min)
FIGURE 11. 5
HPLC separation of carotenoids in carrots.
Search WWH ::

Custom Search