Environmental Engineering Reference
In-Depth Information
Table 2.12
Ratio of the Global Irradiation on a Tilted Surface to a
Horizontal Surface in Berlin and Cairo Calculated Using
the Perez Diffuse Irradiance Model
Berlin
Jan Feb Mar
Apr May June July Aug Sep Oct Nov Dec
Average
Horizontal
1.00 1.00 1.00 1.00 1.00 1.00 1.00 1.00 1.00 1.00 1.00 1.00
1.00
10° South
1.33 1.23 1.13 1.08 1.04 1.03 1.03 1.07 1.12 1.17 1.30 1.36
1.09
30° South
1.90 1.61 1.32 1.17 1.06 1.03 1.04 1.13 1.28 1.43 1.81 1.99
1.19
60° South
2.39 1.88 1.38 1.11 0.93 0.87 0.90 1.03 1.29 1.57 2.23 2.54
1.15
90° South
2.34 1.73 1.15 0.83 0.63 0.58 0.60 0.74 1.04 1.38 2.14 2.51
0.89
45° E/W
0.98 0.99 0.98 0.92 0.91 0.91 0.90 0.90 0.94 0.95 1.02 1.03
0.93
Cairo
Jan Feb Mar
Apr May June July Aug Sep
Oct Nov Dec
Average
Horizontal
1.00 1.00 1.00 1.00 1.00 1.00 1.00 1.00 1.00 1.00 1.00 1.00
1.00
10° South
1.19 1.14 1.08 1.04 1.00 0.98 0.99 1.02 1.06 1.12 1.16 1.20
1.06
30° South
1.47 1.33 1.17 1.04 0.93 0.88 0.90 0.98 1.11 1.26 1.40 1.51
1.10
60° South
1.61 1.36 1.08 0.85 0.67 0.59 0.62 0.74 0.96 1.23 1.49 1.68
0.96
90° South
1.37 1.08 0.75 0.49 0.31 0.25 0.26 0.37 0.61 0.93 1.24 1.45
0.63
45° E/W
0.89 0.89 0.88 0.86 0.86 0.85 0.84 0.85 0.86 0.88 0.88 0.90
0.87
However, near the equator an almost horizontal plane receives the highest
annual irradiation. Table 2.12 shows the energy production over the year for
some surface orientations in Berlin and Cairo.
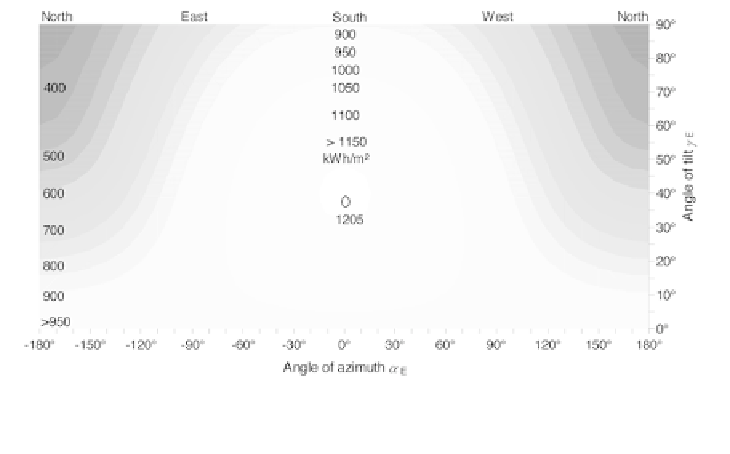
Solar energy systems are often installed on pitched roofs, which are usually
not at the optimum tilt angle. A badly oriented roof can reduce the energy
production significantly; however, the acceptable orientations for the roof have
a rather large tolerance, as shown in Figure 2.16 and Figure 2.17 for Berlin
and Cairo.
Figure 2.16
Annual Irradiation on Various Inclined Surfaces in Berlin
(52.5°N)