Image Processing Reference
In-Depth Information
a single-shot, gradient-echo, echo-planar sequence. The sequence parameters
were TR
=
1500 msec, TE
=
50 msec, flip angle
=
80
°
, NEX
=
1, providing
an in-plane voxel size of 3.125
3.125 mm
2
. Nine axial slices were collected
and were 4 mm thick (skip 0 mm). Corresponding T1-weighted structural
images of the same thickness were collected in the same session in the same
slice locations (TR
×
192 matrix, 2NEX).
Two experimental conditions were a finger-tapping task with left and right
hands, respectively. During each run, the control (motionless and relaxed) and
experimental conditions were alternated (11 scans active, 6 rest) and repeated
so that each experimental condition would occur 4 times for a total of 136
volumes (3.125
=
500, TE
=
11, FOV
=
200 mm, 256
×
4 mm
3
). Four runs of data were collected in this
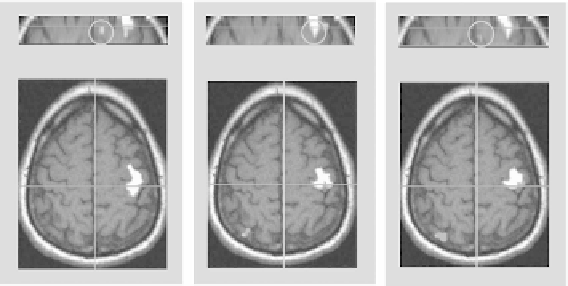
experiment. For this data set, in order to examine the activation detection in
the supplementary motor area (SMA), we focused on the task of right hand vs.
the rest condition, with results shown in Figure 18.9. The window size used is
3
×
3.125
×
×
3
×
3
×
136, covering a brain region whose physical size is almost isotropic
12 mm
3
). Although activations in the primary motor area are
consistently detected by both the ST-SVR method and the traditional
t
-test (on
presmoothed data with empirically chosen FWHM
(9.4
×
9.4
×
×
4.71 mm), ST-SVR on two-run data leads to activations in the SMA (Figure 18.9a),
which are not shown by
t
-test on the same two-run data (Figure 18.9b). For the
t
-test on the two-run data in Figure 18.9b, if we intentionally further decrease
the
t
threshold and try to detect the activations in SMA, spurious activations
over regions other than the primary motor area and SMA, as well as false
activations outside of the cerebellum, would appear. However, if the
t
-test is per-
formed on four runs of data, the activations in SMA are able to show up as in
=
3.68 mm
×
3.68 mm
ST-SVR (2 Run)
t
-test (2 Run)
t
-test (4 Run)
SMA
5.3 < t < 10.24
p < 10
−
3.0 < t < 7.17
p < 0.002
3.6 < t < 9.45
p < 0.001
6
(a)
(b)
(c)
FIGURE 18.9
(See color insert following
page 306
). Multirun result comparison for a motor
experiment of real fMRI data. Top: coronal slices; bottom: axial slices (color activation maps).


Search WWH ::

Custom Search