Geoscience Reference
In-Depth Information
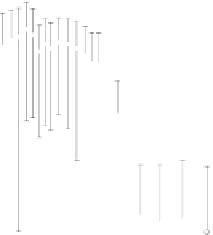
Fig. 4.4
Aerosol size spectra for homogeneous aerosol substance density in the accumulation
mode corresponding to the size (radius) range 0.1-0.5 µm (bins 2-20). The average aerosol size
spectra for each of the 17 data sets are plotted on the left-hand side and the total average spectrum
for the 17 data sets is plotted on the right along with the model-predicted scale-independent aerosol
size spectrum
scale-independent aerosol size spectrum. The corresponding standard deviations for
the average spectra are shown as error bars in Figs.
4.3
.
The total average aerosol size spectrum (right-hand side of Fig.
4.3
) for size
(radius) range less than about 0.5 µm (accumulation mode) is closer to the model
predicted spectrum while for particle size range greater than 0.5 µm (coarse) the
spectrum shows appreciable departure from model-predicted size spectrum pos-
sibly attributed to different aerosol substance densities in the accumulation and
coarse modes. The aerosol size spectra for the two different homogeneous aerosol
substance densities corresponding to the two size (radius) ranges, namely (i) 0.1-
0.5 µm (accumulation mode) and (ii) 0.5-1.5 µm (coarse mode) were computed
separately and shown in Figs.
4.4
and
4.5
, respectively. The observed aerosol size
distribution for the two size categories now follows closely the model predicted
universal size spectrum for homogeneous atmospheric suspended particulates. Ear-
lier studies (Husar
2005
)have shown that the source for submicron (diameter) size
accumulation mode aerosols is different from the larger (greater than 1 µm diam-
eter) coarse mode particles in the atmosphere and therefore may form two different
homogeneous aerosol size groups.


Search WWH ::

Custom Search