Geoscience Reference
In-Depth Information
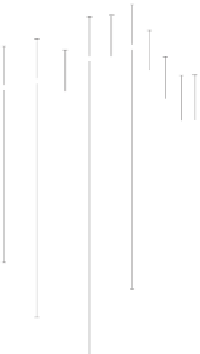
Fig. 4.5
Aerosol size spectra for homogeneous aerosol substance density in the coarse mode cor-
responding to the size (radius) range 0.5-1.5 µm (bins 21-30). The average aerosol size spectra
for each of the 17 data sets are plotted on the left-hand side and the total average spectrum for the
17 data sets is plotted on the right along with the model-predicted scale-independent aerosol size
spectrum
The amount and longitudinal gradient of aerosol sulfate, and a consideration of the
locations of Cu smelters and power plants in Chile, strongly suggest that the sub-
micron aerosol is dominated by anthropogenic emissions (Kleinman et al.
2009
).
The source of the uncertainties displayed by the error bars may be due to mea-
surement noise, independent in every size interval, also may be due to different
aerosol sources. The model predicts universal spectrum for suspended aerosol mass
size distribution(Sect. 1.6.4), based on the concept that the atmospheric eddies hold
in suspension the aerosols and thus the mass size spectrum of the atmospheric aero-
sols is dependent on the vertical velocity fluctuation spectrum of the atmospheric
eddies.
Conclusions
The apparently irregular (turbulent) atmospheric flows exhibit self-similar fractal
fluctuations associated with inverse power law distribution for power spectra of me-


Search WWH ::

Custom Search