Geology Reference
In-Depth Information
B
A
Coral Head
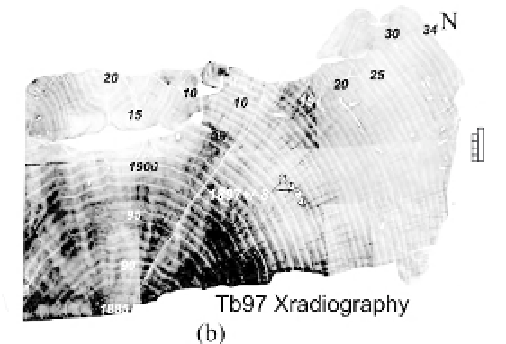
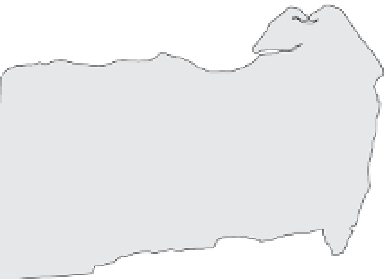
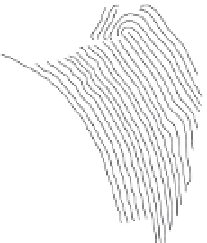
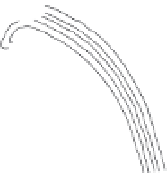
Coral X-Radiograph
0
5
10
15
25
C
D
Dated Annual Bands
Relative Sea Level
0
-5
-10
-15
-20
-25
-30
-35
-4
1890
0
5
10
15
Right side HLS
Right eroded(?) HLS
Right HLS min
25
1900
1910
1920
1930
base
o
f
head
Year
Fig. 5.13
Coral growth bands as tide gauges.
A. Coral exposed due to co-seismic uplift. Surrounding annulus and raised “micro-atoll” in center record interseismic
submergence subsidence. Photo courtesy of D. Natawidjaja. B. X-radiograph of a slice through the right half of a
tropical coral head above the Sumatran subduction zone shows clear annual banding. Note that the irregular upper
surface is the actual surface of the living coral, which was limited in its upward growth by the level of the tide.
C. Line drawing of annual growth bands in the same coral head. U-Pb ages yield a date of 1897 ± 8AD midway
through the coral head. Note the clear upper limits to annual rings after about 1915. D. Reconstruction of relative sea
level based on the age and upper edge of annual rings. The quality and significance of each ring varies because some
appear eroded, some are clear minima, and others appear to be robust indicators of the lowest annual tide or highest
level of survival (HLS). After a 20-year initial interval of more rapid upward growth toward the surface, the coral grew
obliquely outward and more slowly upward as the coast slowly subsided (5.5 mm/yr) with respect to local sea level.
Modified after Natawidjaja
et al
. (2004).
in this outer arc is a purely elastic process through
which interseismic strain is recovered, a
phenomenon consistent with the elastic rebound
theory (Fig. 4.2). The ongoing coral-based geodesy
in Sumatra promises continued insights on the
nature and rates of tectonic processes because of
three critical ingredients: broadly distributed and
reliable geodetic markers (corals); excellent time
control as derived from growth bands and
high-precision U-Pb dates; and rapid tectonic
rates driven by high convergence and numerous
earthquakes. This last attribute dictates that the
Fig. 5.12
(
cont'd
) resulting from the 1946 Nankaido earthquake (
M
= 8.2). Note maximum uplift along southeastern
coast parallel to the Nankai Trough. Strong subsidence occurred just northwest of the zone of maximum uplift. When
coseismic (B) and interseismic (A) deformation are compared, zones of maximum coseismic subsidence coincide
with zones of maximum interseismic uplift and appear compatible with an elastic rebound model (Fig. 4.2).
The southeasternmost sites in both data sets, however, show uplift both during (B) and after (A) the earthquake, and
are not directly compatible with such a model. Modified after Fitch and Scholz (1971).