Environmental Engineering Reference
In-Depth Information
30.0
25.0
20.0
15.0
10.0
5.0
0.0
2004
2010
2030
Scenario 1
(BAU)
2030
Scenario 2
2030
Scenario 3
2030
Scenario 4
Figure 5.20
Aggregate transport CO2 emissions
1.20
1.00
0.80
0.60
0.40
0.20
0.00
2030
Scenario 1
(BAU)
2030
Scenario 2
2030
Scenario 3
2030
Scenario 4
2004
2010
CO
2
Emissions Per Person
(tonnes CO
2
/ person)
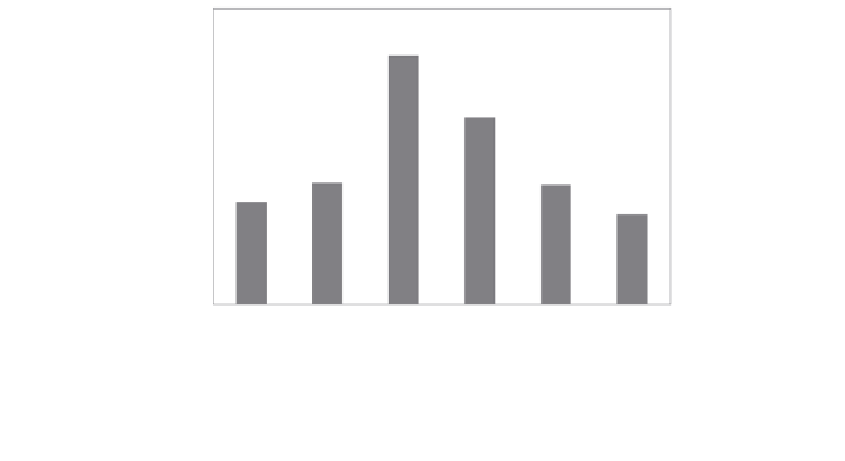
0.42
0.49
1.01
0.76
0.49
0.36
Figure 5.21
Per capita transport CO2 emissions
Scenario 4 is most effective in reducing CO2 emissions and is described in more detail below.
The scenario pushes extremely hard on all of the available policy levers and implements the
technological and behavioural options to a 'high intensity level, achieving a 64 per cent reduc-
tion in transport CO2 emissions on BAU levels, but still representing a 203 per cent increase
on 1990 levels. Car distance and vehicle gCO2/km are the most important features to resultant
emissions. In Scenario 2 (and 1) overall travel distance increases markedly on current levels,