Biomedical Engineering Reference
In-Depth Information
Mean rank
Ideal
1
“Real”
t
3
0.63
H
Approximate middle
t
2
H
0.1
t
1
Mean value
0.01
1
10
100
1000
Life
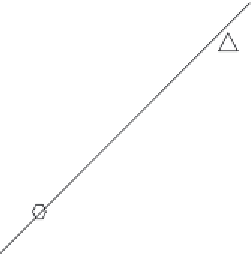
Figure 12.5
A typical Weibull plot.
Table 12.1: Typical PMS Data for Weibull Analysis
(a) Original Data
(b) Ranked Data
Sequence
Life (No. of Uses)
Life (Ranked)
Mean Rank
1
150
75
1/9
=
0.11
2
100
78
2/9
=
0.22
3
75
95
3/9
=
0.33
4
200
100
4/9
=
0.44
5
125
125
5/9
=
0.55
6
78
150
6/9
=
0.66
7
95
200
7/9
=
0.77
8
215
215
8/9
=
0.88
The next step is to plot this on Weibull paper. You can purchase Weibull paper, or simply generate
your own. It is a log-log plot: the vertical axis being the mean rank, and the horizontal axis life.
Figure 12.5
illustrates a typical Weibull plot. The ranked data would be plotted on the graph -
note both axes are logarithmic. Ideal data would lie on an exact straight line; however this is
often not exhibited by real data. We must straighten the line. To do this we determine a value
called
t
o
, and to do this we use Equation (12.2).
(
t
t
)(
t
t
)
3
2
2
1
t
t
(12.2)
0
2
(
t
t
)
(
t
t
)
3
2
2
1
The ideal is then produced by plotting life as (
t
-
t
o
) instead of life alone. The significance of
t
o
is that this is the life below which the device can be called intrinsically reliable. The value of


Search WWH ::

Custom Search