Biomedical Engineering Reference
In-Depth Information
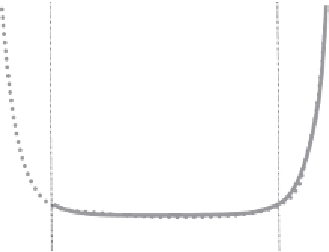
Soak test
duration
Number
of
failures
“Bathtube”
Failures “hidden” to
customers
Time to
failure
Figure 12.4
Bathtub curve after “soak testing” initiated.
These types of devices tend to fail early on in their life (due to component failure and poor
assembly). Those that survive this early period tend to last “forever,” but they start to fail as
they get old; and this tends to be after a specified period of time. The points tend to make a
“bathtub” shape. Televisions, washing machines, etc. tend to illustrate this type of curve - and
that is what a 12-month guarantee is for! Companies overcome this by instituting soak testing
(running the devices for the specified period to overcome the first part of the curve). What
everyone is trying to achieve is illustrated in
Figure 12.4
.
12.3.3 Weibull Plot
The Weibull (pronounced “vibull”) plot is arguably one of the most commonly applied
techniques for predicting failure (
Carter, 1986
). The main reason for this is it works -
irrespective of the arguments about its statistical validity. We shall not consider the statistical
proofs - that is best left to more worthy texts; instead we shall consider its application. The
basis for the analysis is the Weibull plot, and this is illustrated in
Figure 12.5
. To best describe
the plot we shall first discuss the data required.
The Weibull analysis depends on the collection of failure data in the form of “time to failure,”
“uses to failure,” or “cycles to failure.”
Table 12.1(a)
depicts some typical data as collected by
your PMS process.
The data in
Table 12.1(b)
has been ranked in ascending order. The mean rank is determined
using Equation (12.1) - much the same as we did for 2
k
experiment design:
(12.1)
Ri/(N1
where i is the rank number and N is the number of data points. In the case of equal ranking do
not forget to increase the rank at the next change.


Search WWH ::

Custom Search