Game Development Reference
In-Depth Information
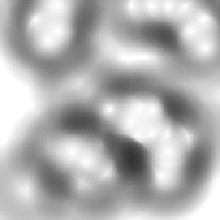
Figure
73
- Intensity map.
It's very useful to separate the heat map generation into intensity map and a colorization
pass because this allows us to change the colors of the heat map on the fly. The heat map
colorization can be provided by a color look up table, a one dimensional texture with a
gradient, the most familiar of which would range from blues for the lower values, towards
reds as values grow in intensity, and then towards yellow and finally white.
Figure
74
- Heat map color look-up table.
The look up table is a texture 256 pixels wide and 1 pixel high, each pixel in the table is
usedtorepresentaheightvalue.Thevalueofeachpixelintheintensitymapwepreviously
generatedisintherange0..255,where0isblackand255iswhite,ifwethenusethisvalue
as an index into the look up table we can apply that color, creating our finalized heat map.
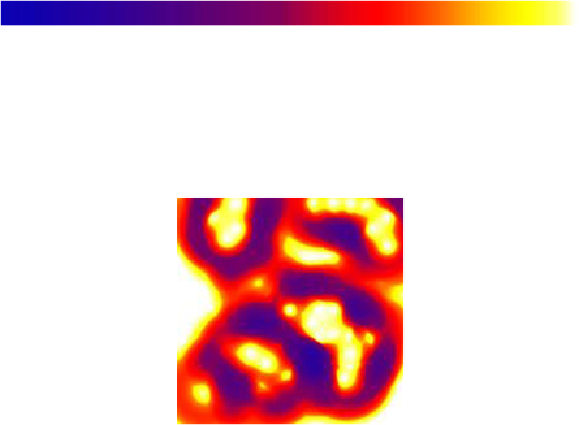
Figure
75
-Colorized heatmap.
Changing the look up table allows the heat map to acquire a different look and it can be
used to represent different types of data.


