Information Technology Reference
In-Depth Information
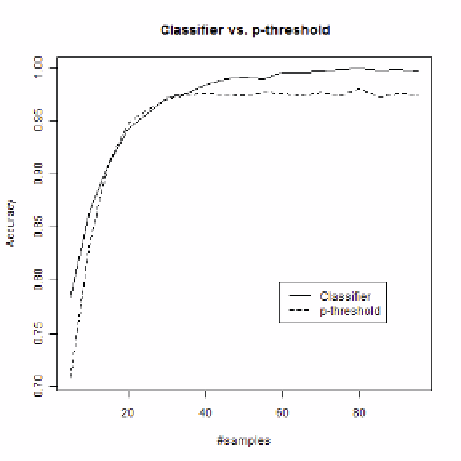
Fig. 5.
Accuracies of significance classifier and p-threshold (normal distributions with mean 20,
stdev 2 vs. mean 22, stdev 2)
The following tree is an example for a trained classifier with 30 provided p values:
currP <= 0.129937
| currP <= 0.033323: diff (158.0/6.0)
| currP > 0.033323
| | avg <= 0.099929: diff (16.0)
| | avg > 0.099929
| | | totgrad <= 0.000215: diff (63.0/21.0)
| | | totgrad > 0.000215: same (4.0)
currP > 0.129937: same (259.0/40.0)
The results of these experiments indicate an advantage of the trained classifier in com-
parison to the threshold-based method in many cases. Significant (
α
=0
.
05
) differences
in the accuracies can be observed for 5-40 p values in the first setting. In the second set-
ting (where the mean difference is greater), for 5 and 10 as well as from 40 - 95 better
results can be achieved using the classifier. In the third setting (even greater difference
between means), the classifier is better for 5 and the settings with 20 or more p values.
5.2
Significance Classification for Random Distributions
In a second test, we do not use distributions with fixed mean and standard deviation val-
ues, but randomly generated distributions. The generation of the random distributions
works as follows:
-
Select a random mean value for the first distribution:
μ
1
∈
[50
,
500]
.
-
Randomly select a standard deviation value for the first distribution
sd
1
∈
[0
,
0
.
3
μ
1
]
.