Graphics Programs Reference
In-Depth Information
Now we need to get the handles of all the lines. We could have said
h=
plot(y)
to get them, but for now we use the
get
function:
h = get(gca,'children')
The
gca
function returns the handle of the current axes, and
get(gca,'children')
returns the handles of all the current axes' chil-
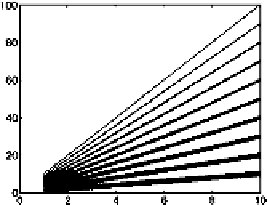
dren (the lines on the plot). Now we want to change the thicknesses of
the lines. We set up a vector of line widths with as many elements as
there are lines:
widths = linspace(.1,10,length(h));
The widths of the lines will vary from a minimum of 0.1 to a maximum
of 10. We use a
for
-loop to change the width of each of the lines:
for i = 1:10
set(h(i),'linewidth',widths(i));
end
24 Demos
The matlab demos are well worth browsing. You can learn about a
subject (often reading references are given), as well as learning about
matlab's capabilities. Of interest to sonar and radar signal processors is
matlab's Higher Order Spectral Analysis toolbox containing, for exam-
ple, functions for direction of arrival estimation (beamforming plus other
methods), time-frequency distributions, and harmonic estimation. Type
help hosa
for a list of functions in the Higher Order Spectral Analysis
toolbox. Browsing the demos or doing a keyword search may save you
from writing your own matlab code and re-inventing the wheel. Type
demo
to get the panel: