Graphics Programs Reference
In-Depth Information
The handle of a Figure is the number (1, 2, etc.) that normally
appears in the Figure's title bar (supplied by the windowing system).
All of the graphical objects, except the Root object, have low-level
creation functions in which you can specify their properties. For exam-
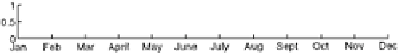
ple, here is how to create a set of axes with the
x
-axis tick marks labelled
by months of the year:
lbls = ['Jan|Feb|Mar|April|May|June|'...
'July|Aug|Sept|Oct|Nov|Dec'];
clf
axes('position',[.1 .5 .8 .1],'xlim',[1 12],...
'xtick',1:12,'xticklabel',lbls)
The general format of object creation functions is
handle =
function
('
propertyname
','
propertyvalue
')
The output of the function is the handle of the object. This handle
can then be used in subsequent calls to
get
and
set
to modify the
properties of the object. The
propertyname
s are displayed by mat-
lab with capitalisation to make them easier to read; for example, the
VerticalAlignment
text property or the
YAxisLocation
axes property.
When you are typing property names, you do not need to use the full
name or any capitalisation; you need only use enough letters of the prop-
erty name to uniquely specify it, and matlab does not care what capi-
talisation you use. Nevertheless, when writing m-files, it is a good idea
to use the full property name because abbreviated names may no longer
be unique if extra properties are added in future releases of matlab.
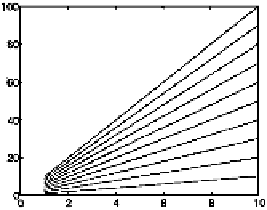
Example: Line Width
The default way to plot a matrix is to draw one line for each column of
the matrix, with the lines differentiated by colour. Suppose instead that
we want to differentiate the lines by their thicknesses. One way to do it
is as follows. First generate the data and plot it:
y = [1:10]'*[1:10];
clf
plot(y)