Graphics Programs Reference
In-Depth Information
audiotool. On a PC the volume can be controlled from the “properties”
panel of the sound recorder.
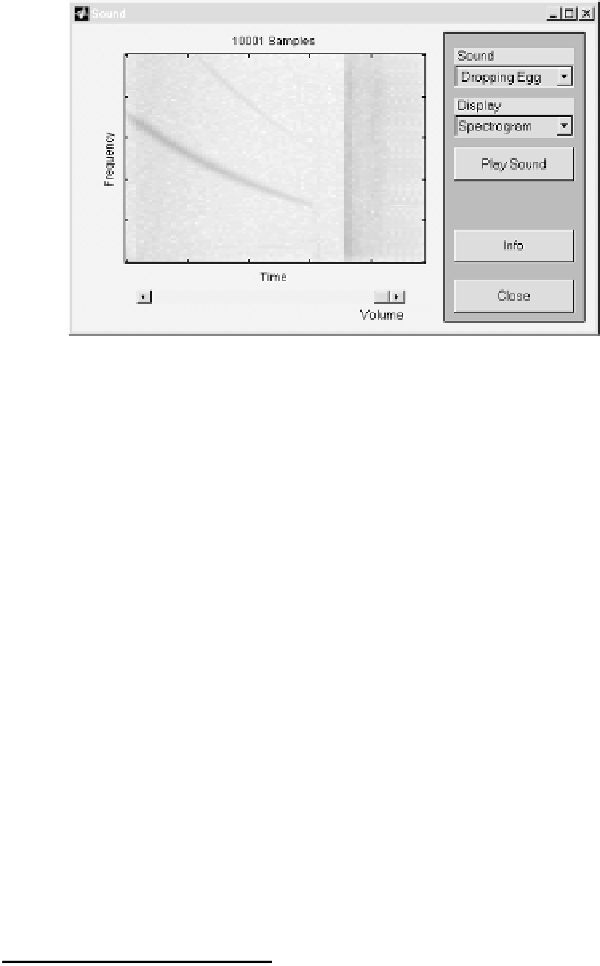
You can invoke a sound demo GUI by typing
xpsound
. This GUI
includes these bird chirps plus a few other sounds, three different display
types, a volume slider, and a play button.
20
Time-Frequency Analysis
Signals, such as the sound data of the previous section, often consist of
time series data with a time-varying frequency content. The
specgram
function allows you to analyse this kind of time-frequency data. As
an example we generate a frequency modulated carrier and analyse its
frequency variation with time. The
modulate
and
vco
function can be
used to produce signals with many different modulation types.
7
We
begin with a linear frequency sweep from 0 to 500 Hz sampled at 1 kHz.
First, you must prepare a frequency control vector, which is normalised
between
1 corresponds to the minimum frequency and
1 corresponds to the maximum frequency. Here we use a linear frequency
control and 8192 points:
1 and 1, where
−
−
x = linspace(-1,1,8192);
Now use the
vco
function (in the Signal Processing Toolbox) to convert
this to a frequency modulated signal:
Fs = 1000;
y = vco(x,[0 500],Fs);
The input vector
[0 500]
says that our frequency sweep will go from
0 Hz to 500 Hz and the sampling frequency is
Fs = 1000
Hz. The first
thousand points of this signal reveal the steady increase in frequency:
7
In fact what we are doing here could also be done with the m-file
chirp.m
(not
to be confused with the data file
chirp.mat
).