Graphics Programs Reference
In-Depth Information
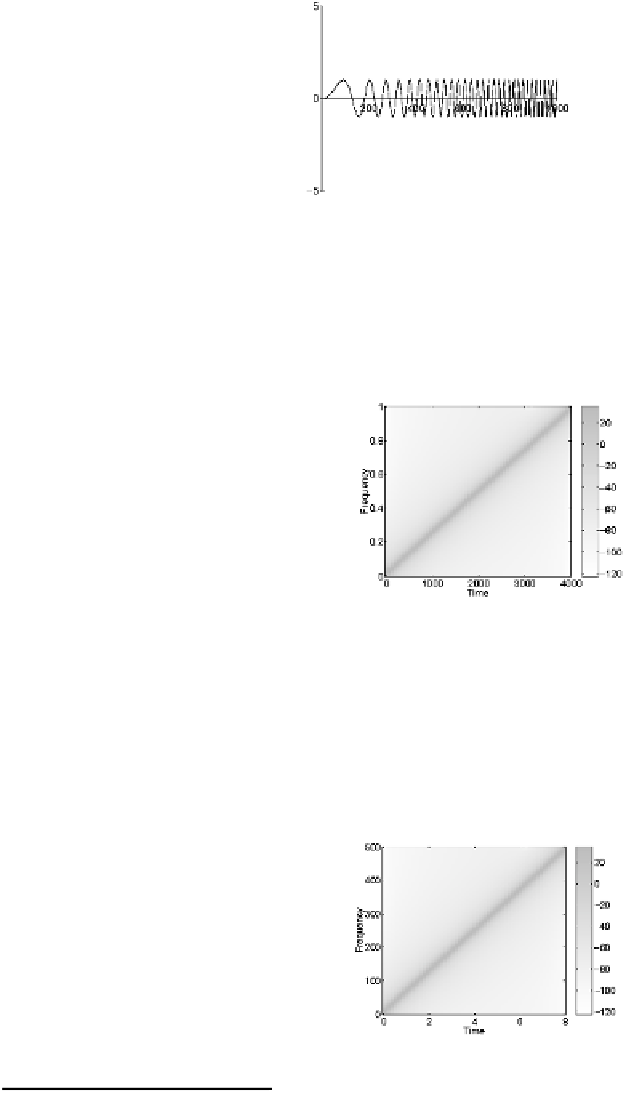
plot(y(1:1000))
axis([0 1000 -5 5])
zeroaxes
The frequency content of this signal as a function of time can be calcu-
lated using the
specgram
function. This function uses the Short Time
Fourier Transform (STFT) technique. The STFT chops up the signal
into a series of short segments and calculates the FFT of each segment.
Each FFT becomes the estimate of the frequency content at that time.
For our example we can get a quick display by typing:
clf
specgram(y)
colormap(flipud(gray/2+.5))
colorbar
The linear increase in frequency with time is clearly displayed, although
here we have not told
specgram
what the sampling frequency is, so it
has plotted a normalised frequency scale. If we include the sampling
frequency as an input, we get the true frequencies. If you type
help
specgram
you will see that the inputs are such that the sampling fre-
quency comes third in the list, after the signal itself and the FFT size.
Here we do not want to bother about specifying the FFT size, so we can
just specify the empty matrix for that input and
specgram
will use its
default value of
NFFT = 256
:
8
specgram(y,[],Fs)
colormap(flipud(gray/2+.5))
colorbar
The frequency now goes from zero to 500 Hz.
8
Many of matlab's functions behave this way: specifying the empty matrix will
tell the function that you want to use its default value for that input.