Graphics Programs Reference
In-Depth Information
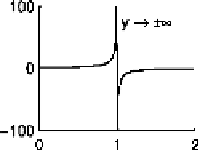
x = linspace(0,2);
y = 1./(1-x);
plt(x,y)
text(1,75,...
' y \rightarrow \pm\infty')
The T
E
X syntax of '
_
' and '
^
' to produce subscripts and superscripts is
also supported:
t1 = linspace(-5,5);
y = cos(t1.^2);
plt(t1,y)
title('cos(t_1^2)')
If the sub- or superscript is more than one character, use curly brackets
to define the scope:
title('cos(t_{i,j}^{2m + 1})')
For degree symbols (e.g. 30
◦
), use
\circ
.(In
E
X you would use
\circ
in a superscript,
$30^\circ$
, but doing that in matlab makes the
degree symbol too high and too small.)
title('Plot for \alpha = 30\circ')
33.2 Symbols in Tick Labels
To put T
E
X symbols in tick mark labels you cannot use the commands of
the
xlabel
family; they currently do not interpret the T
E
X syntax. How-
ever, you can replace the default ticklabels with Text objects that contain