Graphics Programs Reference
In-Depth Information
the required symbols. The m-file
ticklabelx
does such a replacement.
You might like to look at it in your editor to see how it works. To use
it, you supply a list of tick marks with the T
E
X symbols included:
x = linspace(0,pi,99);
plt(x,sin(x))
xt = 0:pi/6:pi;
set(gca,'xtick',xt)
axis tight
tikstr = {'0','\pi/6','\pi/3',...
'\pi/2','2\pi/3','5\pi/6','\pi'}
ticklabelx(tikstr)
33.3 Global Object Placement
Complex displays might contain many Axes or other objects and you may
want to place text, lines, or other objects globally without reference to
any particular Axes object in the display. These objects are children of
Axes objects, so they must be placed relative to some Axes object, but
we can use a trick. The trick is to create an invisible axes object that
covers the entire display and place the required objects inside that. For
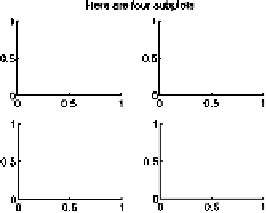
example, consider the following technique to create a global title to a
series of subplots:
subplot(221),subplot(222)
subplot(223),subplot(224)
axes
str = 'Here are four subplots';
text(.5,1.05,str,...
've','bo','ho','c')
axis off
Here, the last four inputs to the
text
command are abbreviations for
the title alignment:
'VerticalAlignment', 'bottom', 'Horizontal
-
Alignment', 'center'
.
Exercise 18
Why not use
title
instead of
text
in the previous
example? (Answer on page 192.)
Another way to put text on a graphic independently of the data plotted
is to use normalized position units. The reference point of the text will
then refer to the area occupied by the axes, independently of the data
plotted. Suppose, for example, that you want to print a parameter on a
plot whose axes scaling might change.