Geography Reference
In-Depth Information
f
T
(τ) =
λ
exp (-
λ
τ),
where
τ
=
dT
is the time between two subsequent earthquakes,
λ
is the flow
rate of events in time,
λ
=
N
/
τ
av
, where
τ
av
is the average recurrence time.
A
B
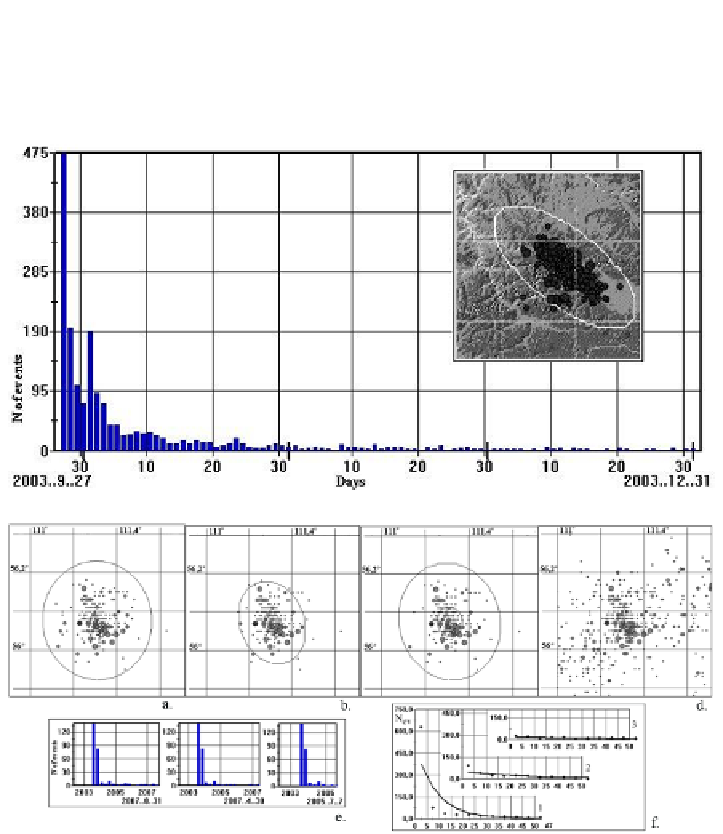
Figure 6. A -
Histogram of the daily number of aftershocks of the 2003 Altai (Chuya)
event. Shown on the right is a map view of the aftershocks. B - Options for calculating
elliptic metrics to determine aftershocks, with an example of the
M
= 5.8 earthquake of
16.09.2003 in BRZ: a) confidence ellipse (equal probability), b) weight root-mean-
square deviation [29], c) root-mean-square deviation, d) space distribution of events
before removing aftershocks, e) time distribution of aftershocks identified by different
ellipse metrics (a), (b) and (c),
R
s/n
= 15, f) deviation of the observed number of
earthquakes (
M
≥ 1.5 since 1987) from theoretical Poisson's distribution before (1) and
after (2, 3) removing aftershocks that followed the
M
= 5.8 event of 13.05.1989.