Environmental Engineering Reference
In-Depth Information
S
p
a
t
i
a
l
S
p
a
t
i
a
l
4
4
2
2
L
a
g
o
f
L
a
g
o
f
0
0
R
e
s
i
d
u
a
l
−
2
R
e
s
i
d
u
a
l
−
2
−
4
−
4
−
6
−
4
−
2 0
Residual from Spatial Error Regression
2
4
6
−
6
−
4
−
2 0
Residual from OLS Regression
2
4
6
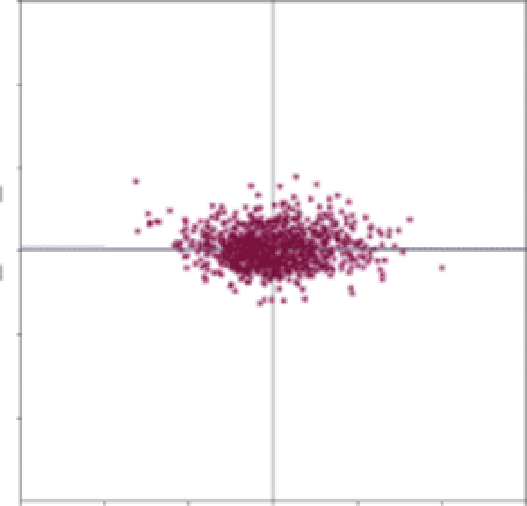
FIGURE 16.2
Moran scatterplots of the residuals from the OLS regression of all explanatory variables (Table 16.3, Model 3) (left) and spatial error model regression (right). For
each scatterplot, the horizontal axis plots the observed residual value and the vertical axis plots the spatial lag of the residual value.


Search WWH ::

Custom Search