Database Reference
In-Depth Information
4. Give the report a title, such as
CategoryID Counts
.
5. Insert a description if you like.
6. Select a visualization if you wish. If not, just leave it as
None
. (We decided to
choose a column chart here.)
7. Choose a time range from the time range picker if you like, by choosing
Yes
or
No
.
8. When you are done, click
Save
.
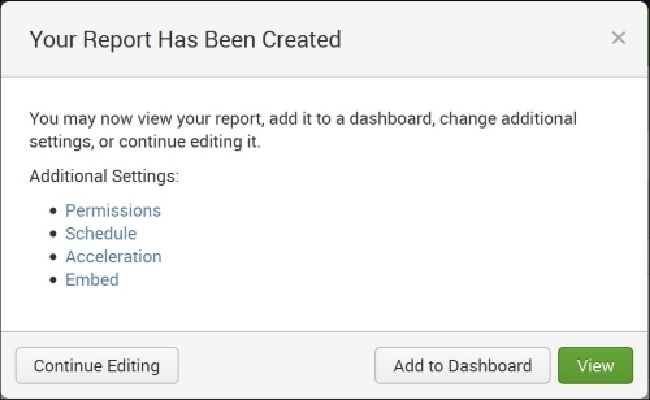
9. You will see a box that says
Your Report Has Been Created
and will give you
additional options:
Box Showing Your Report Has Been Created
You now have the following options:
• You can set permissions to view, edit, and delete the report.
• You can schedule the report to be run (every hour, day, week, or month) at a cer-
tain time to process data for a specific range of time. You can also schedule an e-
mail to alert you when the report runs or can give instructions for a script to be
run.