Geoscience Reference
In-Depth Information
5
8.3
Tropical Ocean (A)
Tropical Ocean (D)
7
8.2
4
6
8.1
5
3
8.0
4
7.9
2
3
7.8
2
Aragonite saturation
Calcite saturation
1
7.7
1
0
0
7.6
1800
1900
2000
2100
2200
2300
2400
2500
1800
1900
2000
2100
2200
2300
2400
2500
5
8.3
Southern Ocean (E)
Southern Ocean (B)
7
8.2
4
6
8.1
5
3
8.0
4
7.9
2
3
7.8
2
1
7.7
1
0
0
7.6
1800
1900
2000
2100
2200
2300
2400
2500
1800
1900
2000
2100
2200
2300
2400
2500
5
8.3
Arctic Ocean (C)
Arctic Ocean (F)
7
8.2
4
6
8.1
5
3
8.0
4
7.9
2
3
7.8
2
1
7.7
1
0
0
7.6
1800
1900
2000
2100 2200
Year
2300
2400
2500
1800
1900
2000
2100
2200
2300
2400
2500
Year
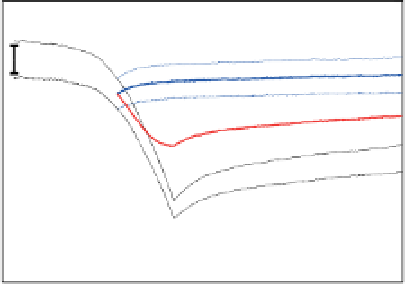
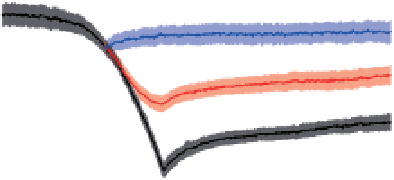
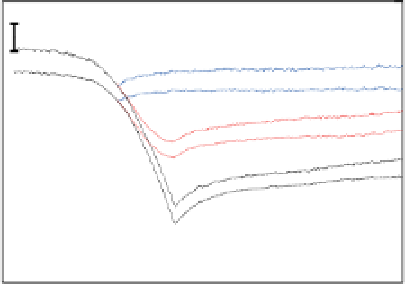
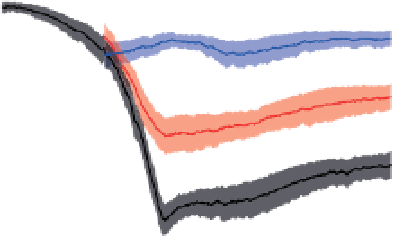
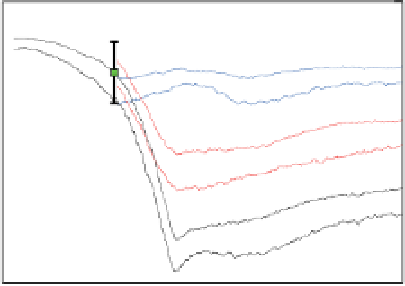
Figure 14.6
Projected evolution of CaCO
3
saturation states (left) and total pH (right) in the surface of the tropical ocean (30°N-30°S), Southern
Ocean (60°S-90°S), and Arctic Ocean (65°N-90°N, except the Labrador and Greenland-Iceland-Norwegian seas) and for emissions commitment
scenarios with no ('Hist' case, blue line, blue shading), low ('B1_c' case, red line, red shading) and high ('A2_c' case, black line, grey shading) emissions
in the 21st century. Saturation with respect to aragonite, Ω
a,
, is indicated on the left y-axis and with respect to calcite, Ω
c
, on the right y-axis. Shown are
modelled annual means as well as the combined spatial and interannual variability of annual-mean values within each region (shading, ±1 SD).
Observation-based estimates are shown by squares for the Southern Ocean and the tropics (GLODAP and World Ocean Atlas 2001, annual mean) and
for summer conditions in the Arctic Ocean (CARINA database) with bars indicating the spatial variability. Model results are from the NCAR CSM1.4-
carbon model. The level of Ω = 1 separating supersaturated and undersaturated conditions for aragonite and calcite is shown by dashed, horizontal
lines.