Geography Reference
In-Depth Information
represents an estimate of total catchment storage. The
traditional runoff component analysis (Schwarze et al.,
1989
) assumes that the rainfall
runoff transformation can
be represented by a combination of linear reservoirs and
identifies a number of runoff components with different
response times. The usual assumption is that the fast
response component relates to shallow flow paths and slow
response to deep flow paths, but this has led to much
debate and controversy (Kirchner,
2003
; Merz et al.,
2006
). More elaborate methods have been presented based
on non-linear relationships between groundwater discharge
and storage (e.g., Wittenberg and Sivapalan,
1999
). Typic-
ally, the temporal change of runoff is plotted versus runoff
itself (e.g., Kirchner,
2009
; Sayama et al.,
2011
). Linearity
of this relationship suggests that the catchment operates
like a linear reservoir; any deviations give an indication of
the non-linearity. In both cases, response times and storage
can be inferred under some assumptions (e.g., runoff is a
monotonically increasing function of catchment wetness,
which applies only in humid climates).
In the second class of methods the runoff recession is
interpreted from a process perspective through the applica-
tion of Darcy
-
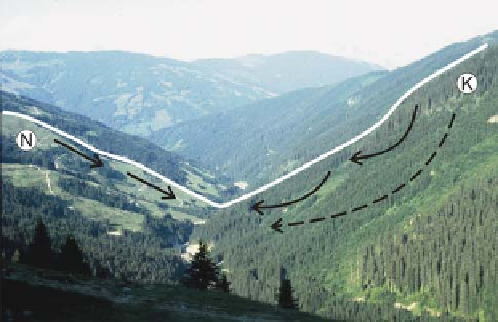
Figure 4.4. Different pathways in the Löhnersbach, Austria.
Tributary from left hillslope (N, Neuhausen) has shallow pathways
causing subsurface flow paths to disconnect during dry periods,
resulting in small low flows. Tributary from right hillslope
(K, Klammbach) has deeper flow paths that stay connected with
the main stream and sustain higher low flows (see
Figure 4.5
).
Photo: P. Haas. From Kirnbauer et al.(
2005
).
This means that the recession analysis is combined with
the Darwinian approach of learning from many catchments
to obtain information that can be generalised to ungauged
catchments (see
Chapter 2
). It is therefore necessary to
understand how the storage
s law to typical hillslopes, with a number of
simplifying assumptions (e.g., linearisation of the equa-
tion). Brutsaert and Nieber (
1977
), for example, estimated
the catchment-scale saturated hydraulic conductivity and
the mean aquifer depth from analysis of recession curves.
Rupp and Selker (
2006
) extended their analysis to settings
where slope is an important driver of flow, or where
hydraulic parameters vary with depth. As noted by Troch
et al.
1993
), when estimating the catchment-scale
hydraulic conductivity by the Brutsaert
'
runoff relationship or, more
generally, the runoff response, is related to catchment
characteristics and to learn from the differences between
catchments. This is the basis of the comparative hydrology
approach (Section 2.2). As Sivapalan (
2009
, p. 1395)
suggested,
-
Nieber technique,
the resulting values are generally one to two magnitudes
larger than their laboratory-derived counterparts. This is
because the catchment-scale estimates implicitly incorpor-
ate the effects of preferential flow, i.e., flow along con-
nected pathways of high hydraulic conductivity/low flow
resistance that extend in the main direction of the driving
gradients. Clearly this is a result one would not be able to
obtain by the bottom-up approach of simulating runoff
using mechanistic, distributed models, because the effects
of the natural co-evolution of catchment characteristics are
not yet quantified.
-
Instead of attempting to reproduce the response of individual
catchments, research should advance comparative hydrology,
aiming to characterize and learn from the similarities as well as the
differences between catchments in different places, and interpret
these in terms of underlying climate
-
landscape
-
human controls.
The comparative hydrology approach is illustrated here by
a comparative analysis of runoff from the Löhnersbach in
Austria (
Figure 4.4
).
Figure 4.5
shows the contributions of
two subcatchments to runoff at the outlet of the entire 16
km² catchment. The Neuhausengraben (
Figure 4.4
, left in
the photo, partly cleared) constitutes about 8% of the
catchment area, which is equivalent to its runoff contribu-
tion during high flows. As the catchment dries out the
runoff contributions drop dramatically and the tributary
eventually falls dry. This can be explained by small trans-
missivities and storage capacities producing shallow flow
paths, so runoff cannot be sustained over longer time
periods. In contrast, the Klammbach (
Figure 4.4
, right in
the photo, forested) constitutes about 15% of the Löhners-
bach catchment area. As the catchment dries out its relative
contributions to runoff actually increase because of the
Learning from spatial patterns of runoff in many
catchments
To take advantage of recession analysis for estimating
runoff in ungauged catchments it is useful to identify the
storage/flow path characteristics in gauged catchments and
relate them to catchment characteristics that are available
everywhere, so the relationship can be used for ungauged
catchments. These can be either statistical relationships
(e.g., regressions) or process-based hydrological models.
Search WWH ::

Custom Search