Geography Reference
In-Depth Information
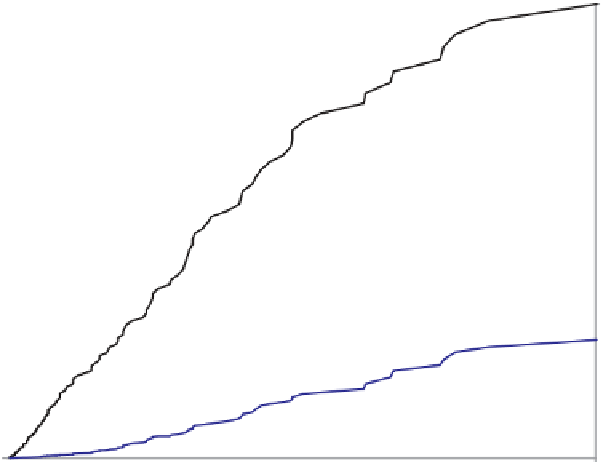
Figure 11.67. Cumulative
distribution plots of daily rainfall
depth, showing precipitation and
runoff for the urban and grassland
catchments from June 2005 through
August 2008. All daily rainfall
depths produced runoff from the
urban catchment (runoff-producing
rainfall occurred on 185 days total).
100
1200
90
Precipitation
Urban Runoff
Grassland Runoff
1000
80
70
800
60
50
600
40
400
30
20
200
10
0
0
0
5
10
15
20
25
30
35
40
45
Daily rainfall depths, mm
Figure 11.68. Modelled vs.
measured runoff volume/unit area for
the urban and grassland catchments
using AGWA look-up table
parameters for all events (red
circles), a calibrated single set of
parameters across all events (blue
triangles), and an optimised
parameter set for each individual
event (black + symbol).
Urban Watershed
Grassland Watershed
25
2
20
1.5
15
1
10
0.5
5
0
0
0
0
5
10
15
20
25
0.5
1
1.5
2
Measured Runoff Volume (mm)
Measured Runoff Volume (mm)
catchment response using the urban model element, it will
be possible to estimate the contribution to increased runoff
from the pervious and impervious areas independently.
Expectations for physical or conceptual modelling of the
response of the grassland catchment should be tempered by
its low ratio of output signal (runoff) to input signal (rain-
fall). Even for large storms with the highest runoff coeffi-
cients, the volume of runoff per unit area is only 1 to 2 mm
for the grassland catchment. When rainfall measurement
error, up to 0.25 mm per 25 mm for the gauges in this study
(Goodrich et al.,
2008
), is taken into consideration, the
noise (rainfall uncertainty) to signal (runoff) ratio is large.
This is a common challenge for modelling runoff in arid
and semi-arid regions, as runoff ratios are small and runoff
per unit area typically decreases with increasing catchment
area (Goodrich et al.,
1997
).
KINEROS2 was used to simulate runoff response from
both catchments with three parameter
scenarios:
(i)
'
'
look-up table parameters from AGWA with no
adjustment; (ii) a single set of optimised parameters used for
all runoff events: and (iii) optimised parameters for each
event. For scenarios (ii) and (iii) the shuffled evolution
complex Metropolis (SCEM
regional
Vrugt et al.,
2003
) scheme
was used to optimise four parameters over all catchment
modelling elements. The parameters varied were saturated
hydraulic conductivity (K
s
), the coefficient of variation of
K
s
, the soil suction term (G), and hydraulic roughness. The
results are illustrated in
Figure 11.68
. As expected, simula-
tion results for the grassland catchment are poor. The
regional AGWA parameters resulted in relatively good
simulations for small to medium events. In all cases the
optimised parameter sets improved simulation results.
-


Search WWH ::

Custom Search