Geography Reference
In-Depth Information
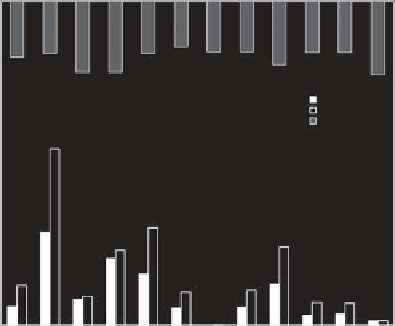
45%
0
15
40%
14
500
13
35%
12
A
min
A
max
Annual rainfall
30%
C2
11
1000
25%
10
9
20%
1500
8
15%
C4
7
10%
6
C5
2000
C9
5
5%
4
0%
2500
C1
C1
C2
C3
C4
C5
C6 C7
Catchments
C8
C9
C10
C11
G1
3
C3
C8
2
C10
C11
C6
Figure 11.54. Annual rainfall (R) and runoff coefficients (ranging
between A
min
and A
max
). From Crabit et al.(
2011b
).
1
G1
0
C7
0
10
20
30
40
50
B (%)
60
70
80
90
100
annual rainfall amount) caused a runoff that accounted for
59% of the annual runoff. For ephemeral streams, these
results show that a few events carry great weight in the
annual water flows at the catchment outlet. When analys-
ing the annual water budget, we observe that the actual
evaporation (equal to the difference between the annual
rainfall and the annual runoff) appears much lower than the
mean inter-annual potential evaporation (around 1000 to
1500 mm/yr). These results confirm the water stress
encountered in Mediterranean regions with differences
from one catchment to another.
The annual runoff coefficient A and the frequency of
occurrence of runoff event B are plotted as hydrological
signatures in
Figure 11.55
. The hatched boxes represent
the uncertainties (the uncertainty associated with B depends
on the rainfall threshold chosen to define a rainfall event). In
spite of these uncertainties, similarities and dissimilarities
between catchment responses were observed: C1, C6 and
C11 catchments appeared similar and different from C4 and
C9.
Figure 11.55
exhibits three extreme signatures: (i) C2
with a low value of B and high value of A; (ii) C7 with low
values of both A and B; and (iii) C8 with a low value of A and
a high value of B. A signature with high values of both A and
B was not observed. This could be explained by a high
density of impervious land (urban area, roads). The studied
catchments covered by agricultural or natural land did not
show this type of response.
Figure 11.55. Annual runoff coefficients (A
min
and A
max
) plotted against
the frequency of the catchment response B. From Crabit et al.(
2011b
).
long-term surveys on one (or few) catchment(s). Comparison
would be helpful to assess the magnitude of processes in
relation to anthropogenic forcing under various morpho-
logical and soil conditions. Comparison between a large
number of catchments in many parts of the world opens a
way to classifying catchments according to hydrological
responses. This classification step would lead to a framework
of
. Lastly, the proposed
new measurement techniques hold a lot of potential for
validating hydrological models.
'
Prediction in Ungauged Basins
'
11.14 OVERCOMING DATA
LIMITATIONS FOR
HYDROGRAPH PREDICTION,
LUANGWA BASIN, ZAMBIA
h. winsemius and h. h. g. savenije
The issue from societal and hydrological perspectives
The Zambezi catchment in Southern Africa is shared by
six countries (Angola, Zambia, Namibia, Botswana, Zim-
babwe and Mozambique; see
Figure 11.56
). Besides
being a major water resource in a semi-arid area, it is
the provider of enormous amounts of actual and potential
hydropower to an energy-scarce region. The real-time
operation of the already existing hydropower dams
(Kariba on the border between Zambia and Zimbabwe
and Cahora Bassa in Mozambique) is complicated by
Discussion
The proposed framework allowed the hydrological signa-
tures of poorly gauged catchments to be compared. Such a
network catchment survey gives opportunities in terms of
catchment comparison under close climatic conditions for
better understanding of processes in addition to classic

Search WWH ::

Custom Search