Geography Reference
In-Depth Information
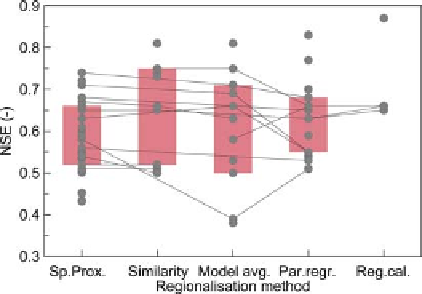
Figure 10.34. Median Nash
Sutcliffe efficiency (NSE) of
predicting hydrographs in ungauged basins stratified by
regionalisation method (see
Section 10.4.4
). Each symbol refers to
a result from the studies in
Table A10.1
. Lines indicate studies
that compared different methods for the same set of catchments.
Boxes show 25%
-
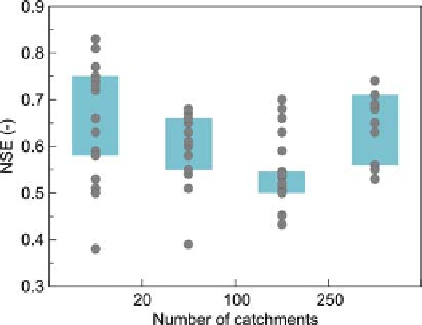
Figure 10.35. Median Nash
Sutcliffe efficiency (NSE) of predicting
hydrographs in ungauged basins stratified by the number of
catchments within each study. Each symbol refers to a result from the
studies in
Table A10.1
. Boxes show 25%
-
-
75% quantiles. After
-
75% quantiles. After Parajka et al.(
2013
).
Parajka et al.(
2013
).
100 000 km
2
. Parajka et al.(
2005
) reported that a signifi-
cant similarity in catchment characteristics over relatively
short distances in Austria was probably one of the reasons
why the spatial proximity and similarity regionalisation
methods performed the best.
group includes 17 results with different regression models
used for transfer of model parameters and one study
(Boughton and Chiew,
2007
) in which a hydrological
model is calibrated to a runoff signature (mean annual
runoff) estimated by a regression model. The model aver-
aging group includes 11 results from either a regional
pooling (averaging) of model parameters or ensemble run-
off simulations for ungauged catchments. Finally, the
regional calibration group includes four results from par-
ameter estimation and model calibration simultaneously in
a number of gauged catchments in a region.
The comparison of the methods (
Figure 10.34
) indicates
that the difference between the studies within each group is
larger than between the groups. The NSE performance
within each group is, for most of the assessments, within
the range 0.5 to 0.75, while the median NSE for each group
varies between 0.58 (spatial proximity) and 0.66 (similar-
ity). The results of studies that compare different
approaches (shown as grey lines in the figure) indicate that
the predictive performance of parameter regression is
poorer than the other methods, with the exception of one
study (
Samuel et al., 2011a
), where the simple average of
model parameters performed the worst. In this case, how-
ever, the predictive performance is generally lower than in
other published studies. The reasons why one approach to
regionalisation may work better than others are discussed
within several inter-comparison studies and other reviews
(
Merz and Blöschl, 2004
; Oudin et al.,
2008
; Parajka et al.,
2005
; Vogel,
2005
). Oudin et al.(
2008
), for example,
reported that spatial proximity slightly outperformed phys-
ical similarity methods in regions with dense networks of
runoff observations. They reported that predictive perform-
ance of these two approaches becomes similar when the
density of stations decreases to less than 60 stations per
How does data availability impact performance?
Figure 10.35
shows the median Nash
Sutcliffe performance
as a function of the number of catchments analysed in each
study. As would be expected, the studies with less than 20
catchments have the largest scatter in the performance
because of the smallest sample size. As the number of catch-
ments increases there is a tendency for the performance to
decrease. It is possible that in some of the studies with few
catchments these catchments were hand-picked in terms of
suitability for regionalisation and this happens less fre-
quently in the studies with more catchments. For studies
with more than 250 catchments the performance, however,
tends to increase. Again, some selection of catchments
based on automated methods may have been performed at
that scale.
More detailed insight on the dependency of performance
on both method and number of catchments per study is
shown in
Figure 10.36
. The maximum performance exceeds
0.8 for similarity, regression and model averaging methods,
but this performance is documented only on smaller data
sets. Interestingly, the performance for similarity-based
regionalisation is clearly lower for assessments with large
data sets. There are only a few studies that compare daily
runoff prediction obtained by different groups of methods
over larger data sets (e.g., three or more groups of methods
and validation in more than 25 catchments). These studies
suggest that for regions with dense networks of gauging
stations (e.g., France or Austria) the spatial proximity
-
Search WWH ::

Custom Search