Geography Reference
In-Depth Information
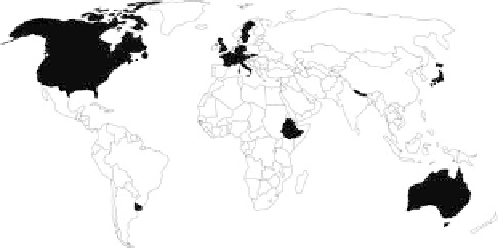
Figure 10.32. Map indicating the countries included in the Level 1
assessment. After Parajka et al.(
2013
).
performance depends on climate and catchment character-
istics as well as on the method chosen. More details are
reported in the comparative study of
Parajka et al. (2013)
.
In both Level 1 and Level 2 assessments, the performance
was evaluated by leave-one-out cross-validation, where
each catchment was treated as ungauged and the runoff
predictions were then compared to the observed runoff.
The performances obtained by the comparative assessment
are estimates of the total uncertainty of runoff predictions
in these ungauged basins.
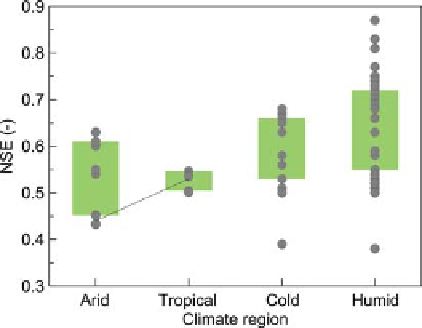
Figure 10.33. Median Nash
-
Sutcliffe efficiency (NSE) of predicting
hydrographs in ungauged basins stratified by climate. Each symbol
refers to a result from the studies in
Table A10.1
. Lines indicate
studies where the same method was applied across different climatic
regions. Boxes show 25%
-
75% quantiles. After Parajka et al.(
2013
).
catchments from high mountain regions. Regionalisation
performance in these catchments was not evaluated separ-
ately and the results for this climate class were presented
combined with cold and humid catchments. Three main
science questions are addressed below.
How good are the predictions in different climates?
Figure 10.33
shows that the performance of runoff predic-
tions tends to be lower in arid than in cold and humid
regions. The median NSE is 0.54, 0.64 and 0.66 in arid,
cold and humid regions, respectively. There is only one
study that compares the performance of the same method
for different climatic conditions: the study of Petheram
et al.(
2012
) indicated by the grey line in
Figure 10.33
.
Their results show that, in Australia, the NSE runoff effi-
ciency is higher in tropical than in arid catchments. The
main reason that the methods perform less well in arid
regions appears to be that arid regions tend to be spatially
more heterogeneous and the hydrological processes more
non-linear.
10.5.1 Level 1 assessment
Table A10.1
(Appendix) lists the 33 individual studies used
in the Level 1 assessment. Many of these studies are based
on large data sets providing a broad range of results from
catchments in different climates. The number of catchments
in each study ranges from 3 to 913, with a median of 36.
Several studies compare different hydrological models and/
or regionalisation approaches, which results in a total of 75
results for predictive performance. The studies differ in
terms of the time periods used and data availability. How-
ever, almost all the studies used lumped conceptual runoff
models, a few studies used semi-distributed (Parajka et al.,
2005
), HRU-based (Viviroli et al.,
2009a
,
b
) or distributed
models (Allasia et al.,
2006
; Samaniego et al.,
2010a
,
b
).
The regionalisation methods used are spatial proximity,
similarity, model averaging, parameter regression and
regional calibration (see
Section 10.4.4
). Most of the studies
evaluate performance by the NSE of daily runoff using
leave-one-out cross-validation. For comparison with the
other runoff signatures in
Chapter 12
, the median NSE of
daily runoff were calculated for all methods in all studies.
The 25% and 75% quantiles of these NSE are 0.53 and 0.68,
respectively.
Figure 10.32
and
Table A10.1
indicate that most of the
studies were performed in Europe and Australia, and more
studies were performed in humid than in tropical and arid
climates. There were only a few studies
Which method performs best?
As mentioned above, the parameter regionalisation
methods used in the studies were spatial proximity,
similarity, model averaging, parameter regression and
regional calibration. The assessments in each group are
not based on exactly the same regionalisation approach,
but the methodology is similar. The spatial proximity
group consists of 33 results that include the nearest-
neighbour, kriging and inverse distance weighting inter-
polation methods. The similarity group uses parameters
from the most similar catchment in terms of catchment
and/or climate characteristics. The parameter regression
including
Search WWH ::

Custom Search