Geography Reference
In-Depth Information
ARS
ARS
1
AZ1
AZ2
CEM
DH1
DH2
EMC
ILL
LMP
NEB
OHD
AZ1
AZ2
CEM
DH1
DH2
EMC
ILL
LMP
NEB
OHD
0.9
0.8
0.7
0.6
0.5
0.4
UAE
UOK
VUB
UCI
ICL
UAE
UOK
VUB
UCI
ICL
0.3
0.2
Interior Points
0.1
Parent Basins
0
median
uncalb
1
2
3
4
5
6
7
8
9
10
11
12
13
14
15
Basin Area km
2
37
49
90
105
285
337
365
420
433
619
795
1233 1489
2258
2484
median
calb
Basin (smallest to largest)
OHD
uncalibrated
LMP
uncalibrated
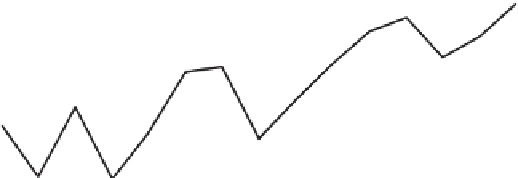
Figure 10.28. Overall performance (correlation coefficient, r
mod
, see McCuen and Snyder,
1975
) for the DMIP2 model inter-comparison
project for hourly runoff simulations in the Oklahoma region. Symbols relate to different models. The solid line is the median of the calibrated
models, while the dashed line is the median for the uncalibrated models. Catchments are organised in order of increasing drainage area.
From
Smith et al. (2012)
.
is a low flow characteristic (
Chapter 8
). If one is interested
in the runoff behaviour during high flows (e.g., for flood
design), an obvious choice is a flood characteristic
(
Chapter 9
). Other runoff characteristics not discussed as
a separate chapter in this topic can also be profitably used,
such as the runoff ratio (i.e., how water is released from the
catchment), baseflow index (i.e., how water travels
through the catchment) and the recession curve (i.e., how
quickly the catchment relaxes after a rainfall event). In
many instances it is prudent to use a combination of a
number of runoff signatures to reflect a spectrum of pro-
cesses well, including the runoff hydrographs estimated by
the statistical methods in
Section 10.3
.
A number of studies have used this method. Bárdossy
(
2007
) considered parameter sets as transferable if the cor-
responding model performance (defined as the Nash
model parameters by mean annual runoff estimated from a
regression against catchment and climate characteristics.
Yadav et al.(
2007
) and Zhang et al.(
2008c
) used various
regionalised runoff signatures (including the uncertainty in
their regionalisation) to constrain a simple lumped runoff
model for catchments in England and Wales in a Monte
Carlo framework. They assessed the predictions with
respect to their consistency regarding the regionalised
ranges of three signatures. The resulting prediction uncer-
tainty was estimated to be reduced in the order of 50%. An
example of simulations run by
Zhang et al. (2008a)
is shown
in
Figure 10.29
. The estimated uncertainty bounds that use
regionalised runoff signatures (white ranges) are clearly
narrower than those that do not use regionalised runoff
signatures (grey ranges). The authors noted that perform-
ance decreased with increasing baseflow index, which sug-
gests that it is the suitability of the model that controls how
easily one can find suitable parameter sets, since the chosen
runoff model was likely to be less suitable for high baseflow
catchments. In a similar study,
Bulygina et al. (2009)
con-
ditioned a runoff model on a regionalised baseflow index in
a Bayesian framework, achieving NSE between 0.7 and 0.8
at different internal gauges.
Kapangaziwiri et al. (2009)
tested the signature regionalisation strategy in South Africa.
-
Sutcliffe efficiency) on the donor catchment was good and
the regional runoff statistics (means and variances of annual
runoff estimated from catchment characteristics and annual
climate statistics) of the recipient catchment were well
reproduced by the model. Results for a number of catch-
ments in Germany showed that the parameters transferred
according to the above criteria performed well on the target
catchments. Boughton and Chiew (
2007
) constrained the


Search WWH ::

Custom Search