Geography Reference
In-Depth Information
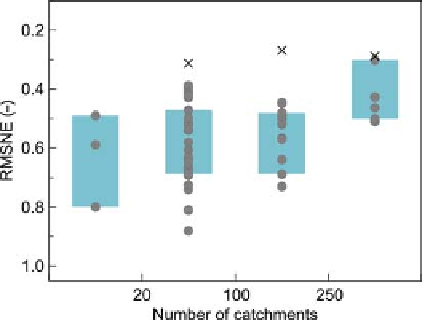
Figure 9.27. Root mean square normalised error (RMSNE) of
predicting the 100-year floods in ungauged basins stratified by the
number of catchments within each study. Each symbol refers to a
result from the studies shown in
Table A9.1
. Circles indicate
cross-validation performance on specific values, crosses
indicate cross-validation performance on volumes. Boxes show
25%
Figure 9.26. Root mean square normalised error (RMSNE) of
predicting the 100-year floods in ungauged basins stratified by
regionalisation method. Each symbol refers to a result from the
studies shown in
Table A9.1
. Circles indicate cross-validation
performance on specific values, crosses indicate cross-validation
performance on volumes. Boxes show 25%
-
75% quantiles. After
-
75% quantiles. After Salinas et al.(
2013
).
Salinas et al.(
2013
).
For example, snowmelt floods tend to be more predictable
than rain-on-snow floods (e.g., Sui and Koehler,
2001
).
spatial correlations or homogeneous regions) and correl-
ations to catchment characteristics. It is also the case that
the geostatistical studies of
Table A9.1
have been per-
formed in data-rich environments, which may partly
explain their better performance.
It is interesting to note that the number of studies apply-
ing regression and index methods is much larger than those
applying geostatistics, which is because they have a longer
tradition in hydrology.
Which method performs best?
The regionalisation methods represented in the assessment
included: (i) regression methods, i.e., 18 results from dif-
ferent regression models where the flood quantiles or the
distribution parameters had been transferred to ungauged
basins; (ii) index methods, i.e., 34 results where a regional
growth curve had been defined for homogeneous regions;
(iii) geostatistics methods, i.e., 5 results where runoff at the
target site was estimated as a weighted mean of runoff at
the surrounding gauges. While the assessments made by
each group are not based on exactly the same regionalisa-
tion approach, the methodology is similar.
Figure 9.26
shows that the geostatistical methods per-
form best (RMSNE of 0.30
How does data availability impact performance?
Figure 9.27
shows the RMSNE as a function of the number
of catchments analysed in each study. The errors clearly
decrease and the performance increases with the number of
catchments included in the analysis. This is because of the
higher stream gauge density in the larger studies, which
makes the transfer of floods across the landscape more
accurate, in particular if there is a stream gauge upstream
or downstream of the target site. Also, the regionalisation
methods may be robust if the total number of stations is
larger.
0.52) across the studies ana-
lysed, although the number of studies is small compared to
the other groups. The regression methods have the lowest
performance, i.e., the largest predictive errors (median
RMSNE of 0.62), and the index methods fall in between.
These results are confirmed by studies that compared
different approaches in the same region (grey lines in
Figure 9.26
). It appears that it may be difficult to find
catchment characteristics that are representative of the
flood generating processes. For example, subsurface char-
acteristics are an important control for flood generation and
these are difficult to capture unless detailed field surveys
are available. Index methods and geostatistics are less
dependent on the catchment characteristics as they usually
take advantage of both spatial proximity (either through
-
Main findings of Level 1 assessment
-
In humid regions predictive performance of floods in
ungauged basins tends to be better than in other
climates. In arid regions the performance is lowest.
-
Geostatistical methods tend to perform better than the
other methods, regressions tend to have the lowest
performance, and index methods lie between geosta-
tistic and regression methods. This suggests that it

Search WWH ::

Custom Search