Geography Reference
In-Depth Information
therefore, again, at least partly a reflection of the differ-
ences in the hydrological characteristics in the regions in
which they were applied. Geostatistical methods have been
applied mainly to Austria (with a small number of catch-
ments from the USA) and the slight increase in perform-
ance with elevation may be a reflection of the increasing
importance of snow processes, where the FDCs may be
easier to predict
than in precipitation-dominated runoff
regimes.
The performance of the geostatistical methods strongly
increases with catchment area, while index and process-
based methods work better for intermediate catchment
sizes. Clearly, as the catchment area increases, the overlap-
ping areas between gauged and ungauged catchments tend
to be larger, so the correlations along the stream network
are likely to increase, which will improve the performance
of the geostatistical methods. For the other methods the
controls are less clear. For the smallest and largest catch-
ments both the index and the process-based methods tend
to underestimate the slope of the FDC. For the process-
based methods (continuous runoff models) this is related to
the calibration that has been done on the basis of minimis-
ing NSE of observed and simulated daily runoff. For that
case study, the slope of the FDC was not captured well
even in the calibration. This points towards the importance
of carefully choosing objective functions in the calibration
of runoff models in the context of the application of
interest.
Which method performs best?
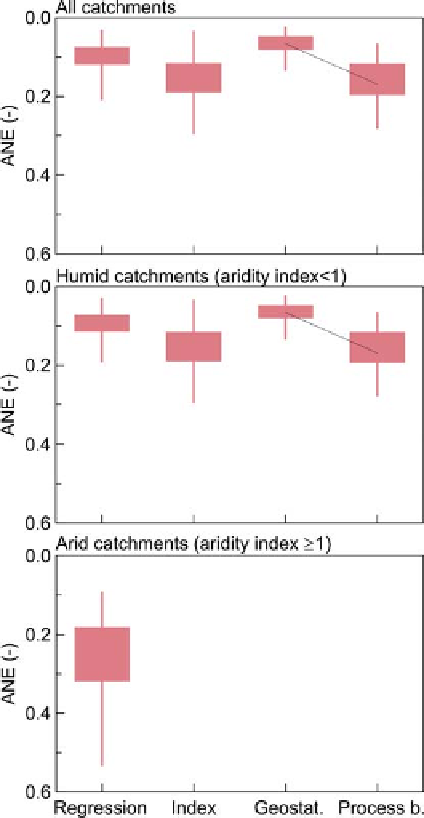
Figure 7.24
summarises the performance for different
regionalisation approaches, stratified by the aridity index.
The top, middle and bottom panels show the performance
for all catchments of
Table A7.2
, and catchments with an
aridity index below and above 1, respectively. The results
indicate that, overall, geostatistical methods perform best,
followed by the regression methods. The data sets used for
the two methods were from Austria and France, respect-
ively, which both have a relatively dense stream gauge
network. The lower performance of the index method in
Italy may be related to the lower stream gauge density.
This is consistent with the dependence of the performance
on the number of catchments in the Level 1 assessment
(
Figure 7.21
). There were insufficient studies for a com-
plete comparison of the methods between arid and humid
catchments.
Figure 7.24. Absolute normalised error (ANE) of predicting the
slopes of the FDCs in ungauged basins for different regionalisation
methods, stratified by aridity. (Top) All catchments; (centre) humid
catchments (aridity index
<
1); (bottom) arid catchments (aridity
index
1). Lines connect median efficiencies for the same study.
Boxes are 40%
≥
-
60% quantiles, whiskers are 20%
-
80% quantiles.
methods that are related to differences in the regions.
A similar but less pronounced pattern can be observed
for the relationship between performance and mean annual
temperature T
A
(second row,
Figures 7.22
and
7.23
).
The performances of the methods as a function of catch-
ment elevation show a complex pattern. For the regres-
sions, the performance seems to increase with elevation,
peak around 1000 m a.s.l. and then decrease. This depend-
ence may be related to a slight decrease of aridity with
elevation for the lower catchments in France and a slight
increase for the higher catchments (
Figure 10.39
), while
in the other regions examined aridity generally decreases
with elevation. The differences in the performances are
Main findings of Level 2 assessment
-
The performance of all methods for predicting the
slope of the FDC in ungauged basins decreases with
increasing aridity, although the strength of decrease
differs between regions.
Search WWH ::

Custom Search