Geography Reference
In-Depth Information
Index
Geostatistics
Regression
Process based
0.4
0.2
0.0
-0.2
-0.4
0.4 0.6 0.8 1.0
E
PA
/
P
A
(-)
2.0
0.4 0.6 0.8 1.0
E
PA
/
P
A
(-)
2.0
0.4 0.6 0.8 1.0
E
PA
/
P
A
(-)
2.0
0.4 0.6 0.8 1.0
E
PA
/
P
A
(-)
2.0
0.4
0.2
0.0
-0.2
-0.4
368 0 2
T
A
(
C)
368 0 2
T
A
(
C)
3
6
8
10
12
368 0 2
T
A
(
C)
T
A
(
C)
0.4
0.2
0.0
-0.2
-0.4
3
Elevation (10
2
m a.s.l.)
6
9
12
15
3
Elevation (10
2
m a.s.l.)
6
9
12
15
3
Elevation (10
2
m a.s.l.)
6
9
12
15
3
Elevation (10
2
m a.s.l.)
6
9
12
15
0.4
0.2
0.0
-0.2
-0.4
0.05 0.1 0.5
Area (10
3
km
2
)
15
0.05 0.1 0.5
Area (10
3
km
2
)
1
5
0.05 0.1 0.5
Area (10
3
km
2
)
1
5
0.05 0.1 0.5
Area (10
3
km
2
)
15
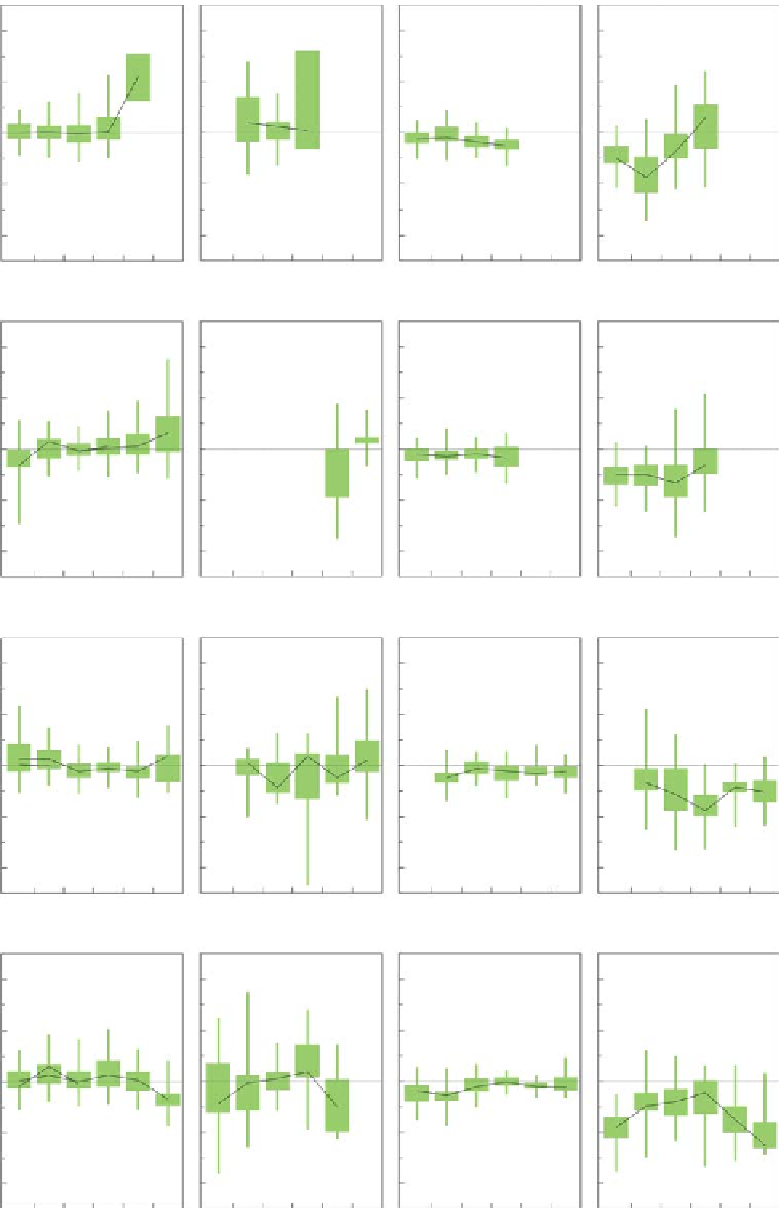
Figure 7.23. Normalised error (NE) of predicting the slopes of the FDCs in ungauged basins as a function of aridity (E
PA
/P
A
), mean annual
air temperature T
A
, mean elevation and catchment area for different parameter regionalisation methods. Lines connect median efficiencies
for the same study. Boxes are 40%
-
60% quantiles, whiskers are 20%
-
80% quantiles.


Search WWH ::

Custom Search