Geoscience Reference
In-Depth Information
temperature (SST) and sea ice distribution were taken from equilibrium simulations
with the coupled atmosphere-ocean model ECHAM5/MPIOM (Mikolajewicz et al.
2007
). The setup followed the PMIP2 protocol (Braconnot et al.
2007
). For time
slices 115 and 126 ka BP insolation was changed accordingly, greenhouse gas
concentrations were kept at 6 ka BP level. The vegetation distribution was speci
ed
according to simulations with the dynamical vegetation model LPJ (Smith et al.
2001
) forced with output from the coupled model. A land grid point was de
ned as
a potential dust source, if the maximal vegetation cover was below 25 %. A detailed
description of the model setup can be found in Sudarchikova (
2012
).
3 Key Findings
The measured dust concentration decreases at EDML over T1 by a factor of 46, i.e.,
in a similar range as in Dome C and at Vostok (Lambert et al.
2008
; Petit et al.
1999
). The previously used non nss-Ca record (Fig.
1
, Fischer et al.
2007b
) yields
slightly lower values due to analytical uncertainties in the Holocene samples. An
absolute minimum of the dust concentration occurs at
11 ka BP, which is in line
with other records from the east Antarctic plateau (EAP). Larger sizes (
*
µ
m)
were found during the Holocene compared to the glacial (
*
2
µ
m). This is in line
with observations for Dome C (Delmonte et al.
2002
). At EDML an absolute
minimum in the dust size occurs at 16 ka BP. This can also be identi
*
2.3
ed in the
EPICA Dome C ice core (EDC), but due to the seasonal resolution in the EDML
core, which is not present in EDC, it is more pronounced in EDML. During
the Holocene and until MIS 3 seasonal signals in the dust concentration and size
can be observed, with amplitudes of the dust concentration up to a factor of 30.
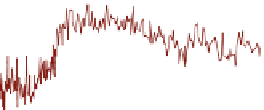
Fig. 1 Dust profile over T1 in the EDML ice core. Oxygen Isotopes, dust concentration (M) and
size (as coarse particle percentage (CPP: mass in the size range 3
-
5
µ
m divided by the mass
concentration in the size range 1
-
5
µ
m))and nss-Ca concentrations (Fischer et al.
2007b
) (left),
dust concentration and phasing of dust concentration and size (right). For the phasing the
correlation coefficient (r) between the dust concentration M and the size (CPP) was calculated over
1 m intervals each


Search WWH ::

Custom Search